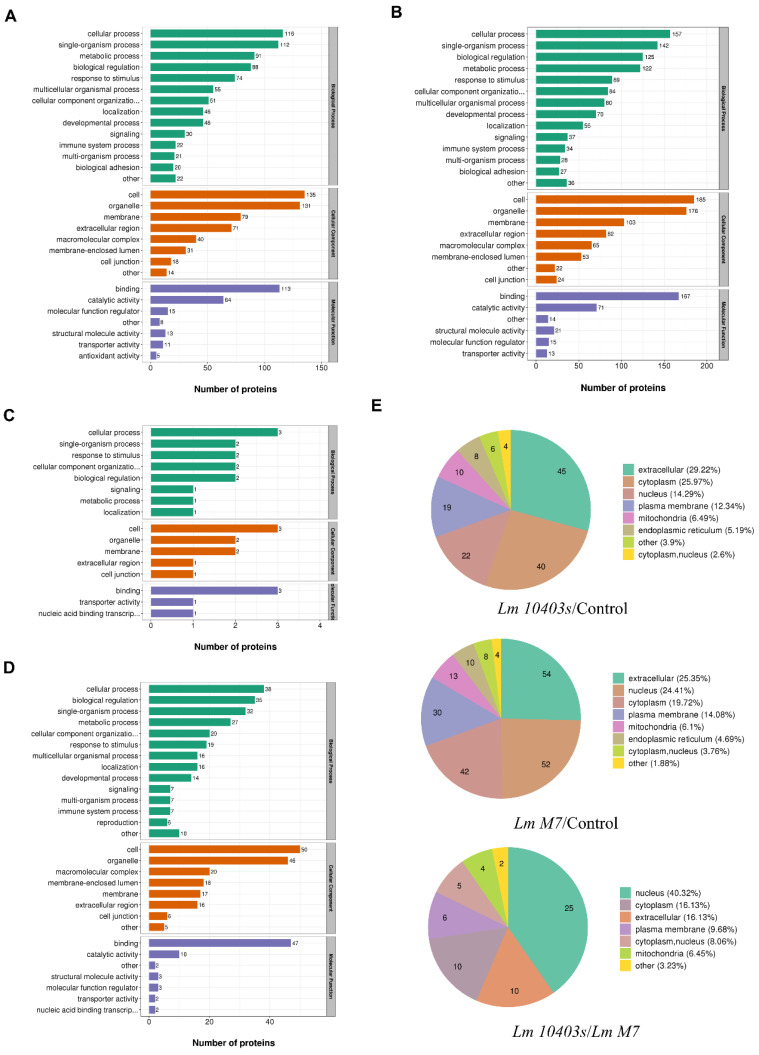
Figure 4.
GO analysis and subcellular locations of DEPs in different comparisons. (A) GO analysis of regulated DEPs in Lm 10403s/control. (B) GO analysis of regulated DEPs in Lm M7/control. (C) GO analysis of the up-regulated DEPs in Lm 10403s/Lm M7. (D) GO analysis of the down-regulated DEPs in Lm 10403s/Lm M7. All proteins were classified by GO terms. X-axis—number of DEPs. (E) Subcellular locations of the DEPs in different comparisons.

