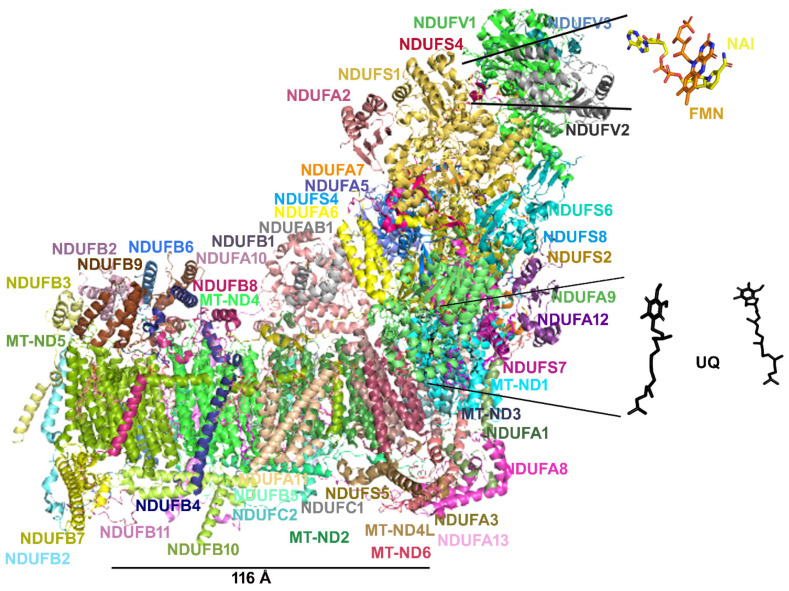
Figure 4.
The sus complex I structure (7v2r.pdb, [157]) is reported in colored cartoon representation as a representative complex I structure from mammalian species. The same color scheme is used for the labels indicating each reported subunit. The subunits NUDFA7, NDUFC1 and NDUFB1 are not viewable in this side view. FMN and NAD+ are reported in orange and yellow sticks, as shown in the zoomed view, at the level of subunit NDUFV1. UQ is reported in black sticks as shown in the zoomed view, at the level of MT-ND1, NDUFS2, NDUFS7 and NDUFA9. The distance between the center of mass of ND5 and the center of mass of the closest ubiquinone molecule is represented by the black solid line, here used as a reference distance.

