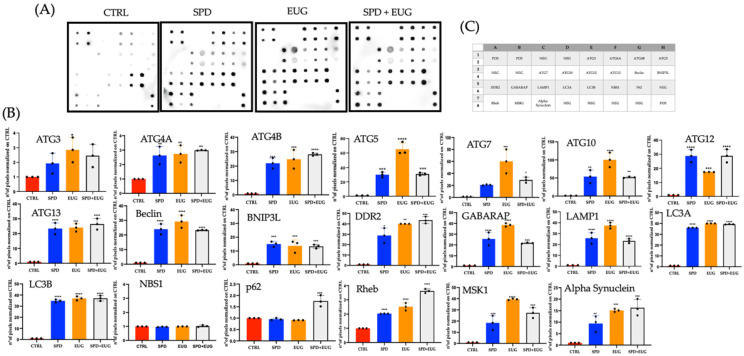
Figure 5.
Expression (A) and expression quantification (B) of 20 individual human autophagy proteins, identified from the position location on the micro-array (C). Expression of the proteins (A) in the control (CTRL), 0.3 mM spermidine (SPD), 0.2 mM eugenol (EUG), 0.3 mM SP + 0.2 mM EUG (SPD + EUG) treated cells. Protein expression for each of the 20 proteins was quantified (B) for each treatment. The number of stars *, **, *** and **** represents significant differences between treatments as determined by one-way ANOVA at the 99% confidence level (p < 0.01). The three black dots indicate the positioning of the individual replicates within the bar for each sample.

