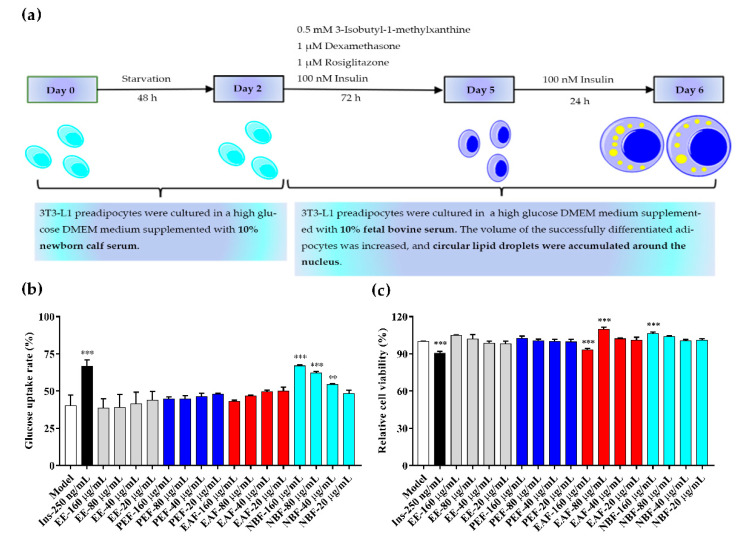
Figure 3.
Adipocyte differentiation process and glucose uptake, cell viability test results of PAHEE and its fractions. (a) Schematic diagram of 3T3-L1 adipocytes differentiation. (b) Glucose uptake rate of different groups (Model, Ins, PAHEE, PEF, EAF, NBF), insulin (Ins) was used as a positive control. (c) Cell viability of different groups (Model, Ins, PAHEE, PEF, EAF, NBF). All values are mean ± SD from a least three independent experiments, and each group is compared with model group, Significant are denoted by symbols: ** p < 0.01, and *** p < 0.001.

