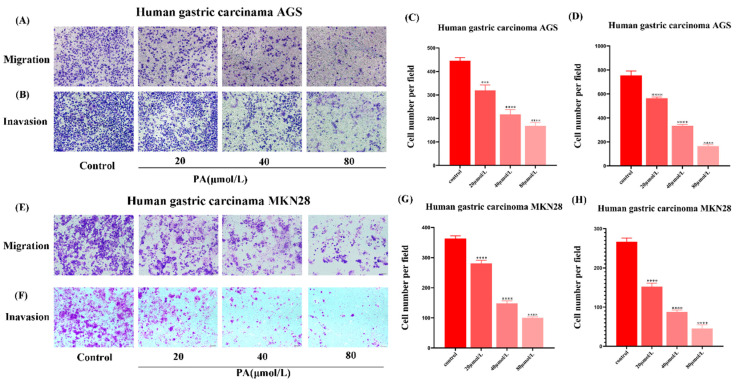
Figure 4.
The effect of PA on the invasion and metastasis of the GC cells. (A,B,E,F) Transwell chamber photograph of the invasion and metastasis assay of the GC cells after different concentrations (0, 20, 40, 80 μmol/L) of PA treatment for 24 h. (C,D,G,H) The summary of the data for the Transwell migration and invasion assays. The GC cells were imaged under a 200× microscope. All scales are 200 µm. *** p < 0.001, **** p < 0.0001.

