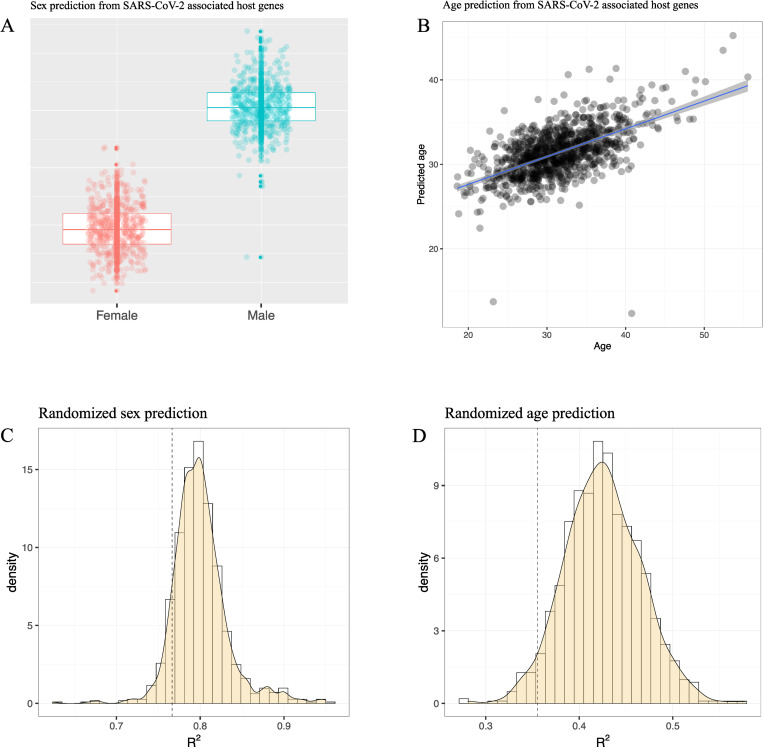
Fig 2. Predicting sex and age in SARS-CoV-2 associated host genes.
Panel A shows the association between autosomal CpGs, linked to SARS-CoV-2 host genes/severe COVID-19, and predicted sex (vertical axis). Panel B shows the association between CpGs predicting age (vertical axis) and given age (horizontal axis). The distributions of the variance explained parameter R2, stemming from 1,000 randomizations of genome-wide randomly selected CpGs against sex and age, are shown in Panels C and D, respectively. The vertical dashed line designates the corresponding R2 for the sex (R2 = 0.77, p = 0.09) and age (R2 = 0.36, p = 0.04) regression models depicted in panels A and B.

