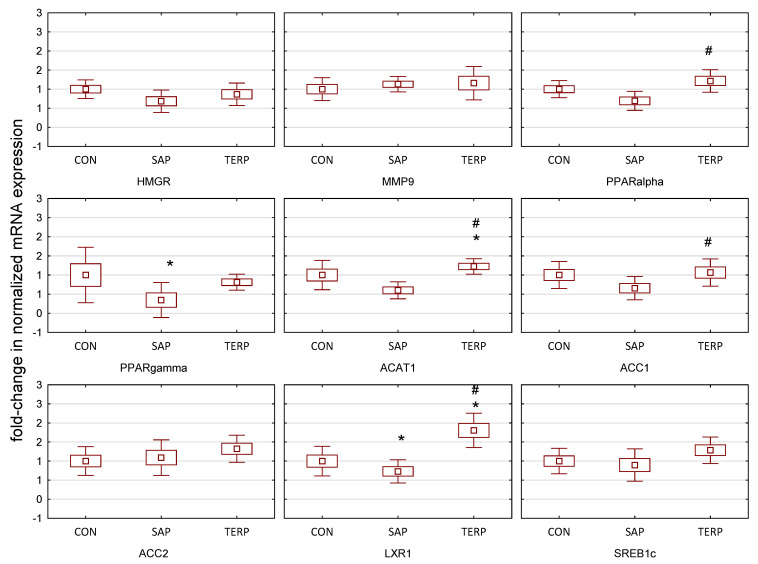
Figure 3.
Expression of genes after treatment of saponin and terpenoid fraction in Zucker rat liver. CON, control group; SAP, rats fed a standard diet with the addition of saponin fraction; TERP, rats fed a standard diet with the addition of terpenoid fraction. Values were normalized against Gapdh expression and presented as a fold-change in relation to gene expression in a control group. Specific comparisons: * p < 0.05 vs. CON; # p < 0.05 vs. SAP (ANOVA followed by the post hoc test). HMGR, 3-hydroxy-3-methyl-glutaryl-coenzyme A reductase; MMP9, matrix metallopeptidase 9; PPARalpha, peroxisome proliferator-activated receptor alpha; PPARγ, peroxisome proliferator-activated receptor gamma; ACAT1, acetyl-CoA acetyltransferase 1; ACC1, acetyl-CoA carboxylase 1; ACC2, acetyl-CoA carboxylase 2; LXR1, liver X receptor; SREB1c, sterol regulatory element-binding protein 1.

