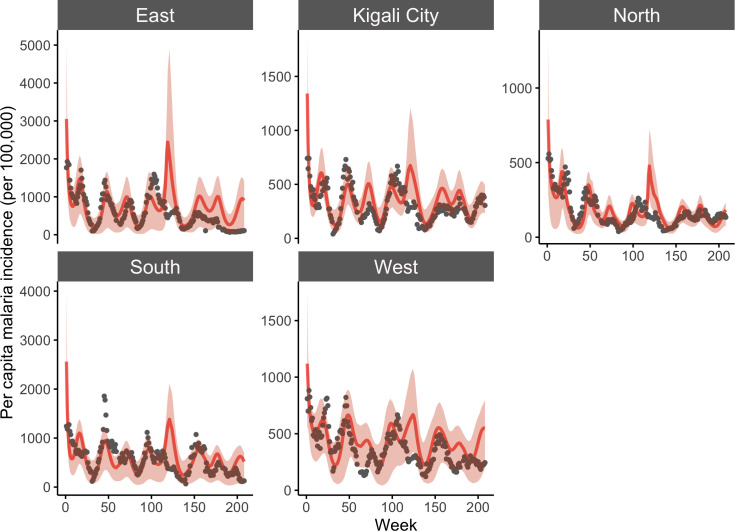
Fig 1. Model-EAKF simulated incidence of malaria at the province level from 2016–2019.
The aggregated results (per capita incidence) from simulations of malaria transmission using the model-EAKF system. Model predictions are shown in red lines, with red shading indicating the 95% credible interval (CI) of model estimated incidence, and reported incidence is shown as gray dots. Note that the range of y-axes for model simulated and reported malaria differ among panels.

