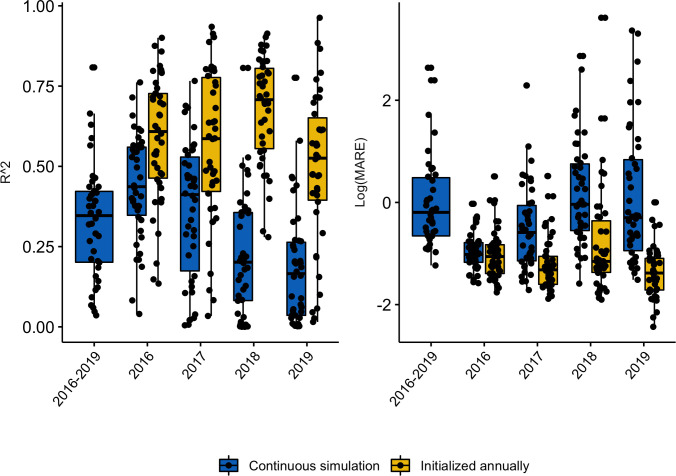
Fig 2. Fit of predicted malaria incidence, across all 42 catchment sites, computed over various study periods.
Outcomes computed from continuous weekly simulation of incidence are indicated by the blue boxes. Outcomes computed from yearly reinitialization are indicated by the yellow boxes. Left panel: the coefficient of determination (R2). Right panel: log-scaled Mean Absolute Relative Error (MARE) across different sites (jittered black dots).

