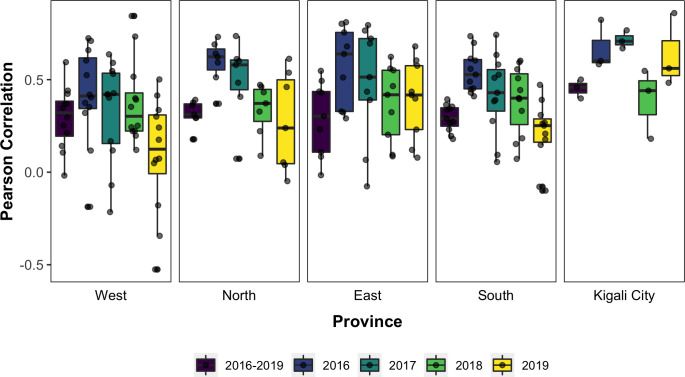
Fig 3. Correlation between reported malaria incidence and cumulative moisture conditions for the final model.
The Pearson Correlation coefficients estimated for study sites (jittered black dots) over the entire study period are in purple and estimates for each individual year (i.e. 2016 to 2019) are in in blue, green, light green, and yellow, respectively.

