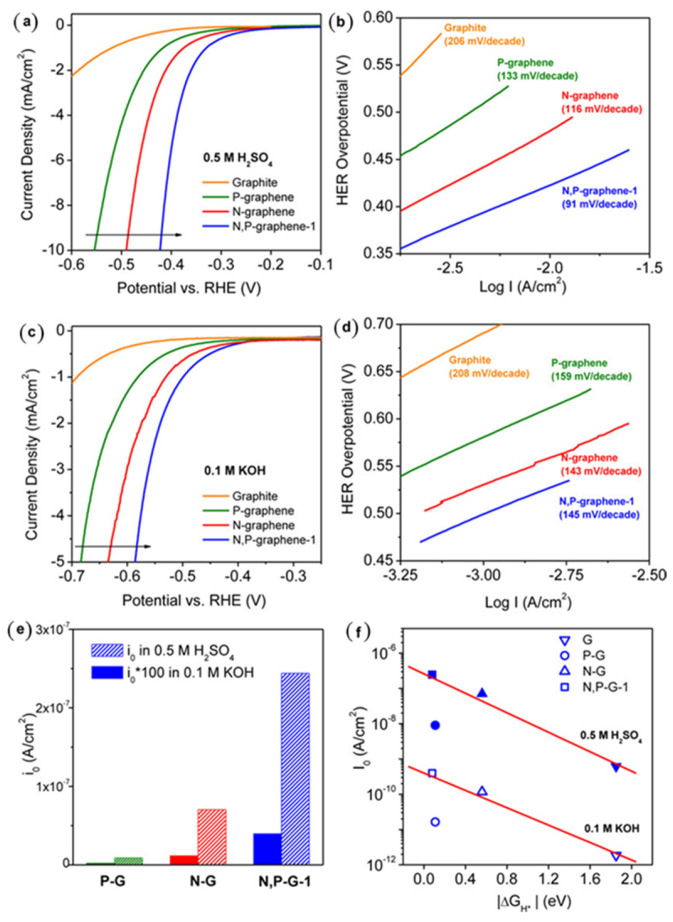
Figure 6.
HER polarization curves and respective Tafel plots of N− and/or P−doped graphene electrocatalysts in (a,b) 0.5 M H2SO4 (pH = 0) and (c,d) 0.1 M KOH (pH = 13). (e) The calculated values of i0 for N and/or P−doped graphene in 0.5 M H2SO4 (patterned bars) and 0.1 M KOH (solid bars) solutions are compared (*100 is 100 times than original data). (f) Relationship between exchange current density (I0) and free energy (ΔGH*) of N− and/or P−doped graphene. Reprinted with permission from Ref. [131]. Copyright 2014 American Chemical Society.

