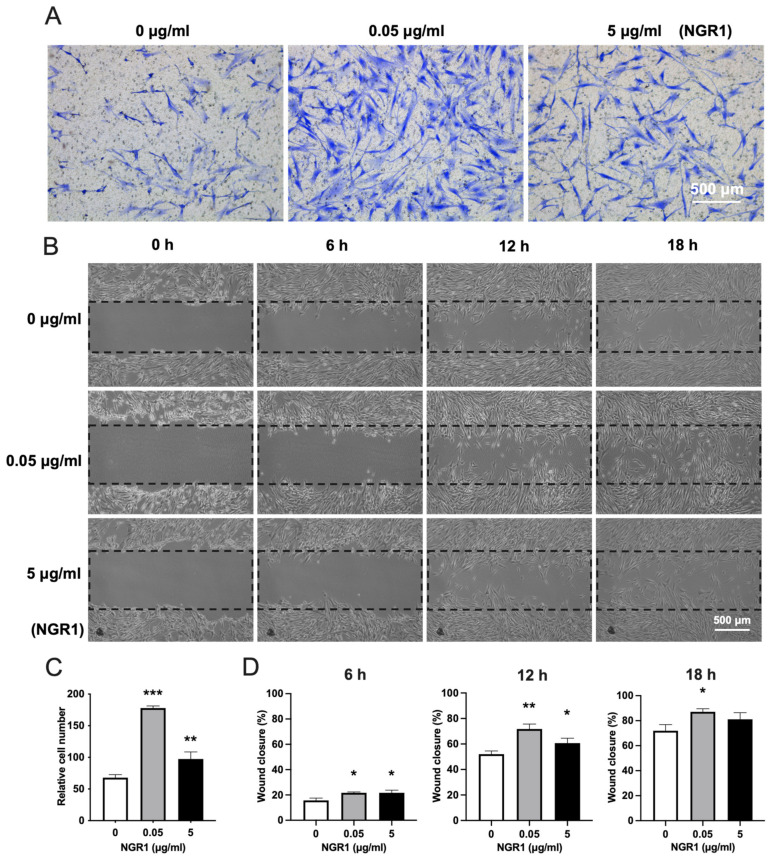
Figure 5.
NGR1 promoted the migration of hASCs. (A) Representative images of transwell migration assay. (B) Representative images of scratch wound assay. (C) Quantitative data of migrated cells in transwell assay, n = 3. (D) Quantification of wound closure, n = 3. Data were analyzed with one-way ANOVA with Bonferroni’s multiple comparison test. * p < 0.05, ** p < 0.01, *** p < 0.001 relative to controls.

