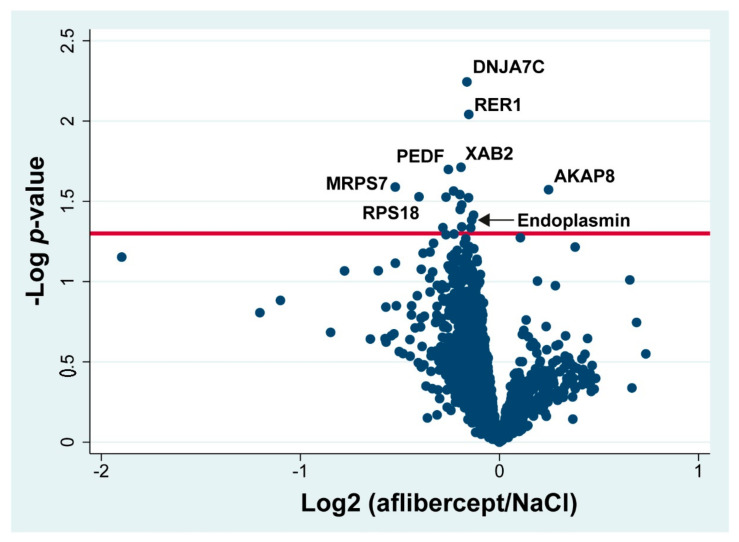
Figure 4.
Volcano plot. Log2 of the ratio aflibercept/NaCl is plotted on the x-axis. On the y-axis, −log p-value refers to the logarithmized p-value from the t-test used to test if a protein was significantly changed. Statistically significantly changed proteins are located above the horizontal line, which denotes a significance level of 0.05. Components of aflibercept are not included in the volcano plot. PEDF: pigment epithelium-derived factor. DNAJ7C: DnaJ homolog subfamily C member 7. AKAP8: A-kinase anchor protein 8. XAB2: Pre-mRNA-splicing factor SYF1. MRPS7: 28S ribosomal protein S7, mitochondrial. RPS18: 40S ribosomal protein S18. RER1: Protein RER1.

