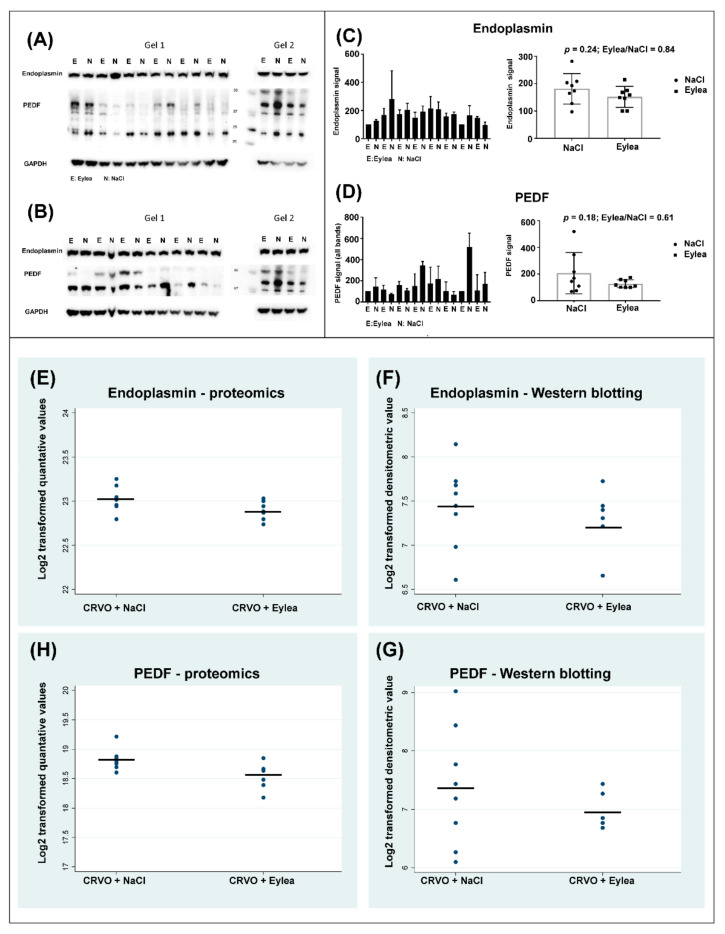
Figure 6.
Western blots comparing CRVO + Eylea vs. CRVO + NaCl. (A–B) Western blotting was performed in two replicates. (C–D) Averages of quantitative data from the two replicates. The changes observed by mass spectrometry in endoplasmin and PEDF following aflibercept intervention were too slight to be confirmed by Western blotting. (E–G) Horizontal lines of the plots denote the means of the quantitative data. Standard deviations were larger in data obtained with Western blotting compared with quantitative data obtained through proteomic analysis. Standard deviations of endoplasmin quantification with mass spectrometry and Western blotting were 0.14 and 0.43, respectively. Standard deviations of PEDF quantification with mass spectrometry and Western blotting were 0.23 and 0.76, respectively.

