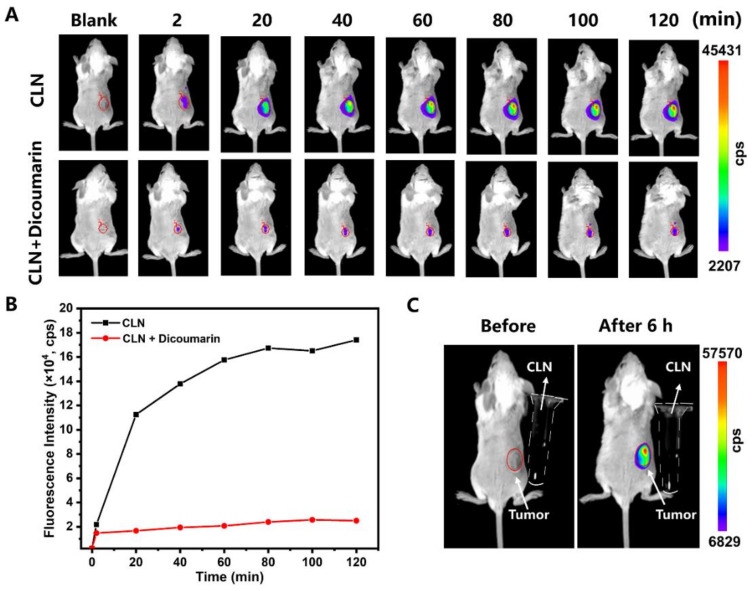
Figure 5.
(A) Fluorescence imaging of the 4T1 tumor-bearing BALB/c mice at 2, 20, 40, 60, 80, 100, and 120 min after the intratumor injections of CLN (2.5 μmol/kg) and CLN (2.5 μmol/kg) + dicoumarin (0.5 mM). (B) Fluorescence intensities of the “CLN” and “CLN + Dicoumarin” groups at the tumor site vs. time (n = 3). (C) Fluorescence imaging of the 4T1 tumor-bearing BALB/c mice before and after 6 h of CLN (2.5 μmol/kg) injection and CLN solution in the Eppendorf tubes (the dotted outline; 500 μM, Tris buffer, 10 mM, pH = 7.4, containing 10% DMSO).

