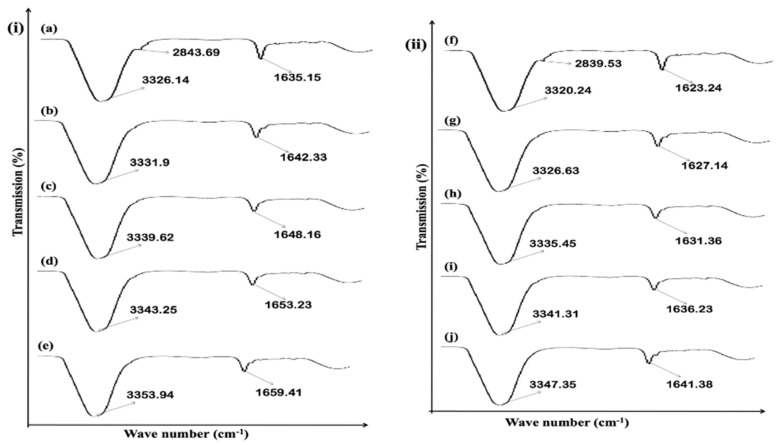
Figure 11.
(i): Representation of rabbit skin epidermis FTIR: (a) untreated (b) treated with F5 (Control), (c) treated with F5-EO-5%, (d) treated with F5-NMP-5%, and (e) treated with F5-OA-10%; (ii): representation of rabbit skin dermis FTIR: (f) untreated, (g) treated with F5 (Control), (h) treated with F5-EO-5%, (i) treated with F5-NMP-5%, and (j) treated with F5-OA-10%. Data are expressed as mean ± SD, n = 3.

