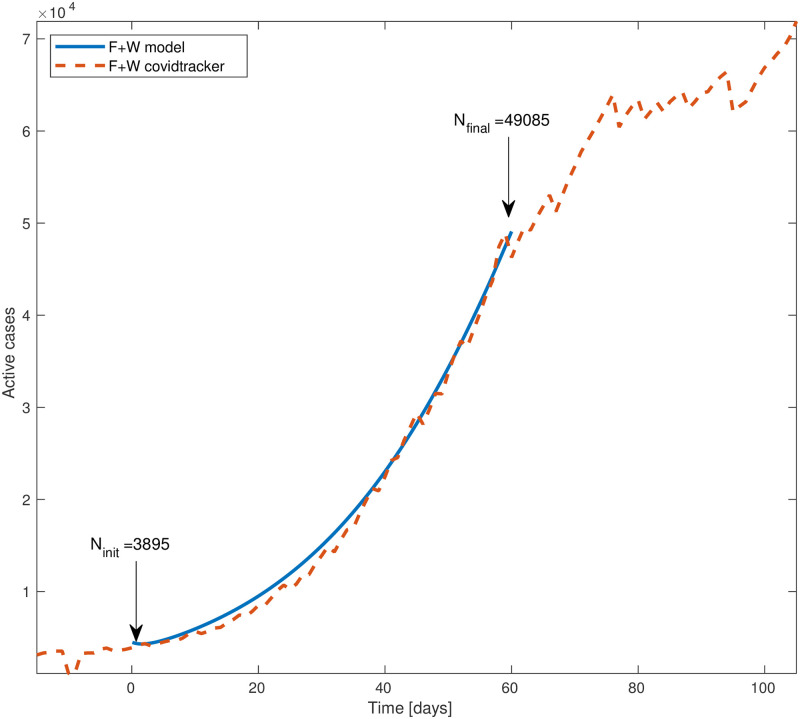
Fig 6. Total number of active cases (‘F’ + ‘W’) in South Carolina vs time.
Blue line is the model simulation and red dashed curve is the number provided by Covidtracking. The model input is the total number of active cases at time t = 0 (May 22, 2020), 3895. The final number of cases of the model is 49, 085, about 6% above the reported number, 46, 275. We assumed the basic reproductive rate R0 = 1.9 to be constant throughout the whole inspected time.

