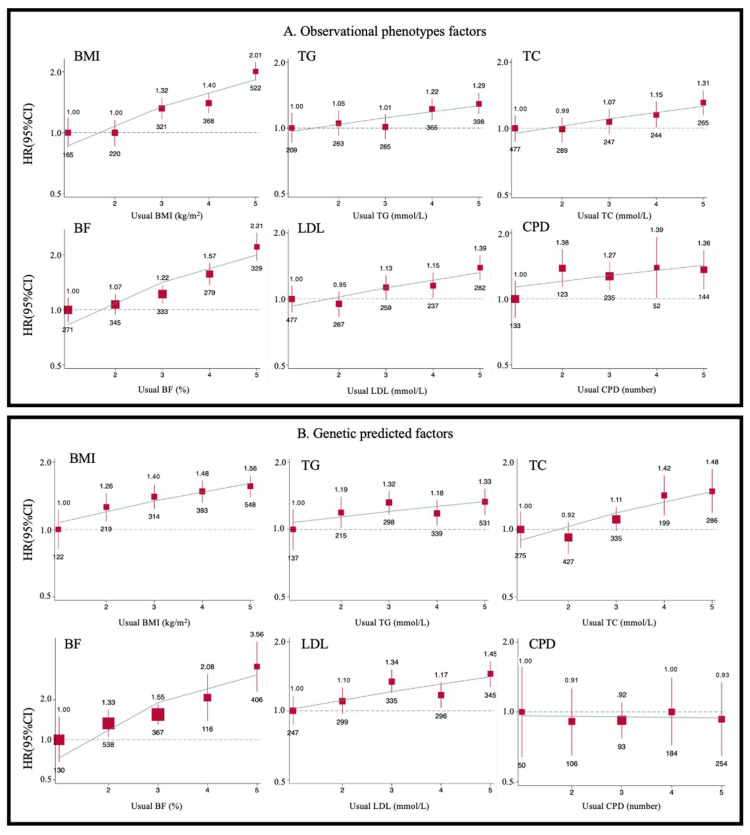
Figure 3.
Adjusted HRs for risk of AVS by fifths of BMI, BF, TG, LDL, TC, and CPD in observational analysis and Mendelian randomization analysis. Cox regression was used to estimate the HRs and 95% CIs for AVS (n = 1602) by fifths of BMI, BF, TG, LDL, TC, and CPD in observational analysis (A) and Mendelian randomization analysis (B). Each square has an area inversely proportional to the variance of the log risk in a specific group. The number below each square is the AVS case number of these factors. The line represents the slope from a weighted linear regression with the weights based on the inverse variance of the log HR.

