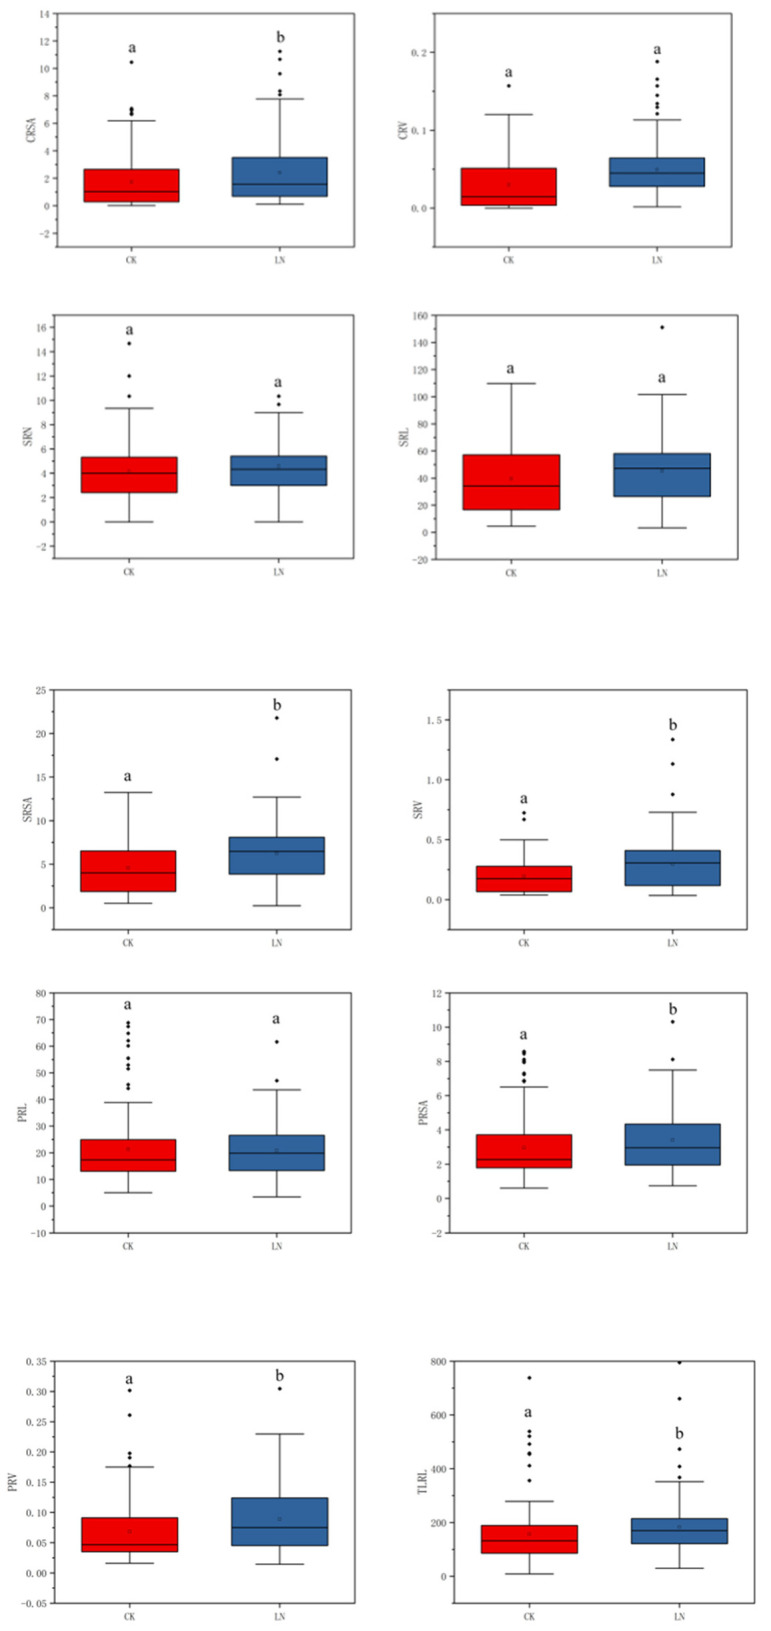
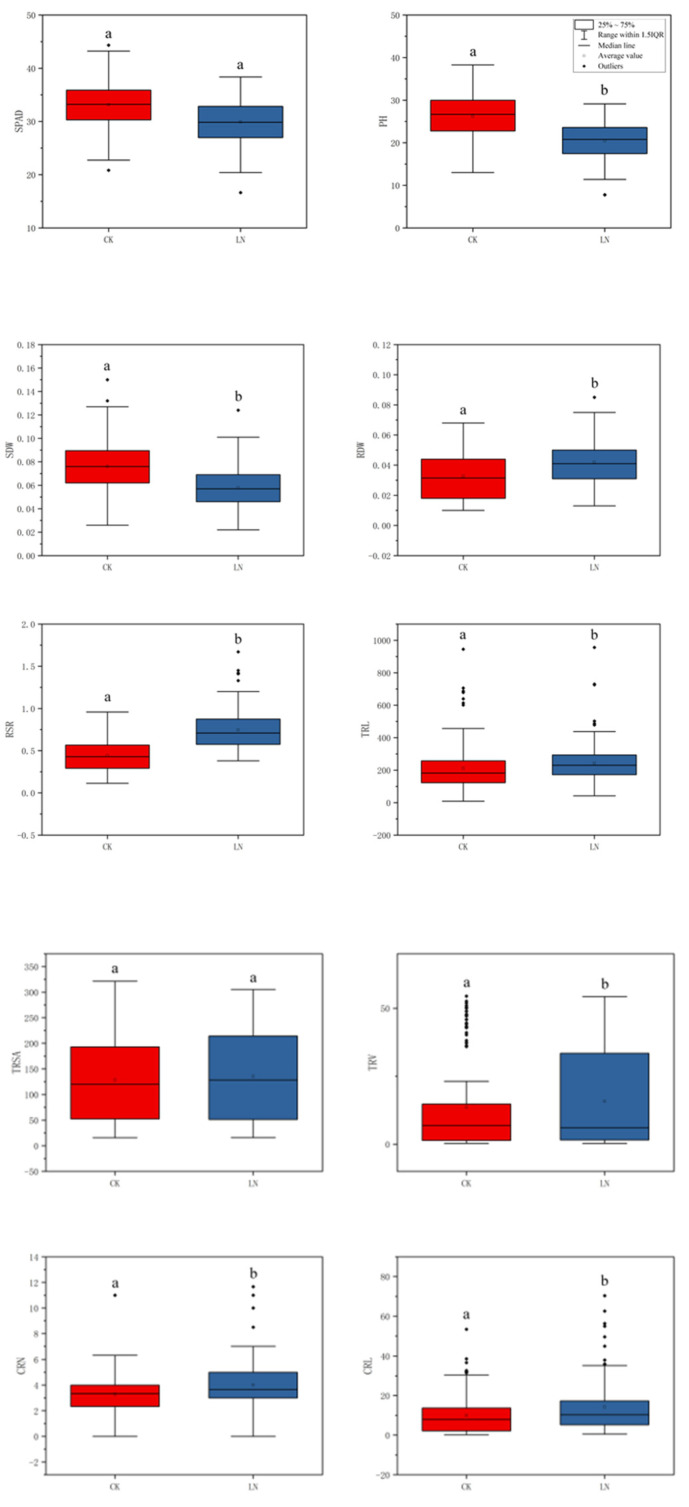
Figure 1.

Phenotype data box plot for different nitrogen environments. In that order: SPAD value of the second leaf; Plant height; Shoot dry weight; Root dry weight; Root-to-shoot ratio; Total root length; Total root surface area; Total root volume; Crown root number; Crown root length; Crown root surface area; Crown root volume; Seminal root number; Seminal root length; Seminal root surface area; Seminal root volume; Primary root length; Primary root surface area; Primary root volume; Total lateral root length. In the Figure, the upper edge of the boxplot represents the maximum value; the lower edge represents the minimum value; the open circles represent the mean; the filled circles represent outliers and contains a line representing the median. a and b indicate the significance between CK and LN (p < 0.05). Red represents CK, blue represents LN.

