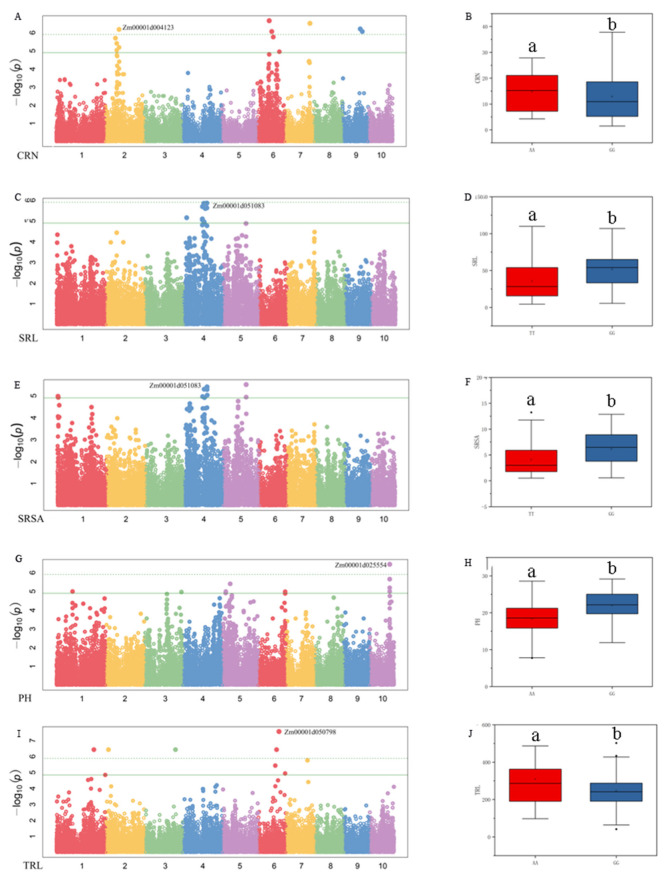
Figure 5.
Manhattan plot of nitrogen efficiency-related traits and allelic effects of significant SNPs corresponding to genes. (A,B) Manhattan plot of CRN under LN and the Zm00001d004123 corresponding to the allelic effect of significant SNP; (C,D) Manhattan plot of SRL under CK and the Zm00001d051083 corresponding to the allelic effect of significant SNP; (E,F) Manhattan plot of SRSA under CK and the Zm00001d051083 corresponding to the allelic effect of significant SNP; (G,H) Manhattan plot of PH under LN and the Zm00001d025554 corresponding to the allelic effect of significant SNP; (I,J) Manhattan plot of TRL under CK and the Zm00001d050798 corresponding to the allelic effect of significant SNP. In the figure, the upper edge of the boxplot represents the maximum value, the lower edge represents the minimum value, the open circles represent the mean, the filled circles represent the outliers, and contains a line representing the median. a and b indicate significance between CK and LN (p < 0.05).

