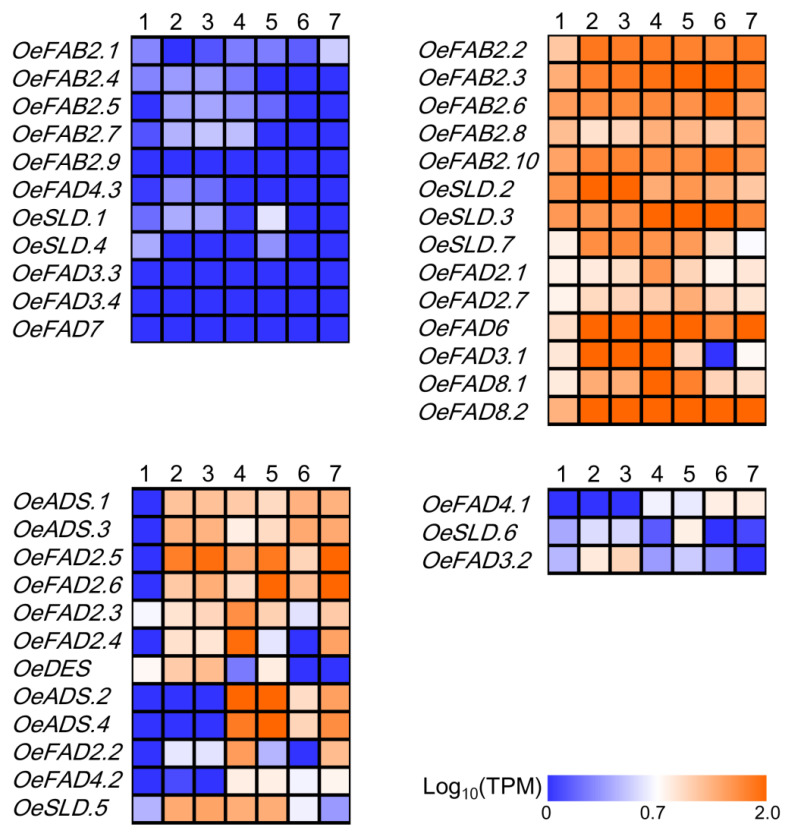
Figure 3.
Different tissue expression profiles of FAD genes in olive. Transcriptome data of different tissues (PRJEB4992) were obtained from NCBI and included five tissues recorded as 1: roots, 2/3: leaves (young/old), 4: flowers, 5: flower buds, 6/7: fruits (green/immature). The log10(TPM) was calculated as the expression level. TPM, Transcripts Per Million. Four expression patterns of FAD genes in olive morphology were shown including the genes with TPM <5.0 in all five tissues, genes with TPM ≥5.0 in five tissues, genes with TPM ≥5.0 in two, three or four tissues and genes with TPM ≥5.0 in single tissue.

