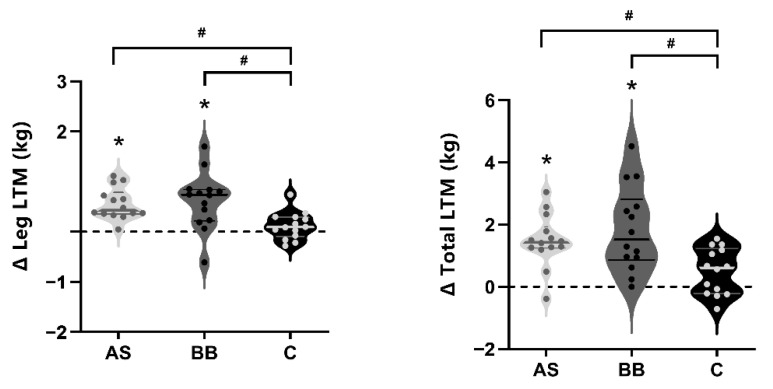
Figure 3.
The violin plots of changes in leg muscle and total lean mass in AS, BB, and C group after 6-week intervention. The thick solid lines indicate the mean value of changes of each group, and the thin solid lines indicate interquartile range. An asterisk (*) indicates the change of the index is significant (p < 0.05). A pound sign indicates the difference between groups is significant (p < 0.05). A pound sign (#) indicates the difference between groups is significant (p < 0.05).

