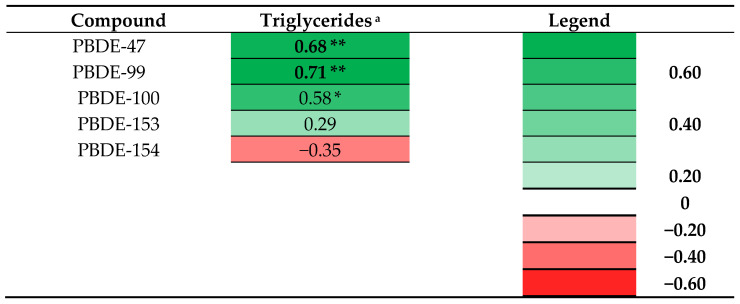
Figure 2.
Heat map of adjusted beta coefficients obtained from a selection of the performed linear regression analyses between prenatal POPs and outcome measurements: log10 transformed prenatal PBDE levels and triglycerides in adolescent girls. * p ≤ 0.10; ** p ≤ 0.05. (a adjusted for age at examination, maternal education, and parity; n = 13).

