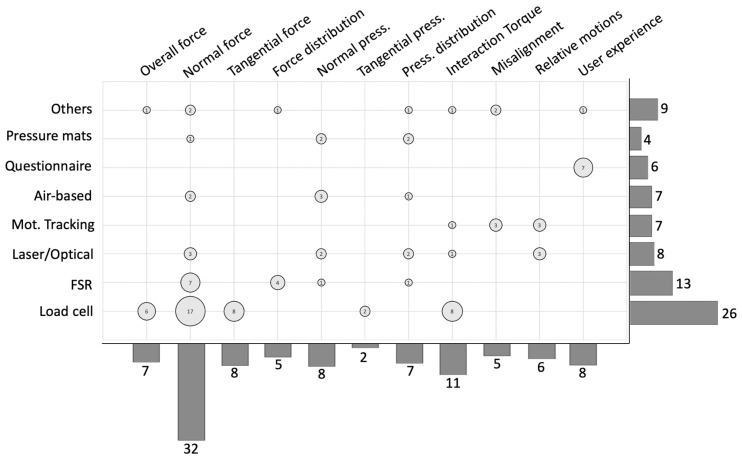
Figure 4.
Metrics and sensors solutions in the results. Bar plot on the right represents the number of publications including the listed sensor solutions. Bar plot on the bottom represents the number of publications including the listed metrics. Circles represent the number of studies extracting the relative metric through the relative sensor solution at the intersection.

