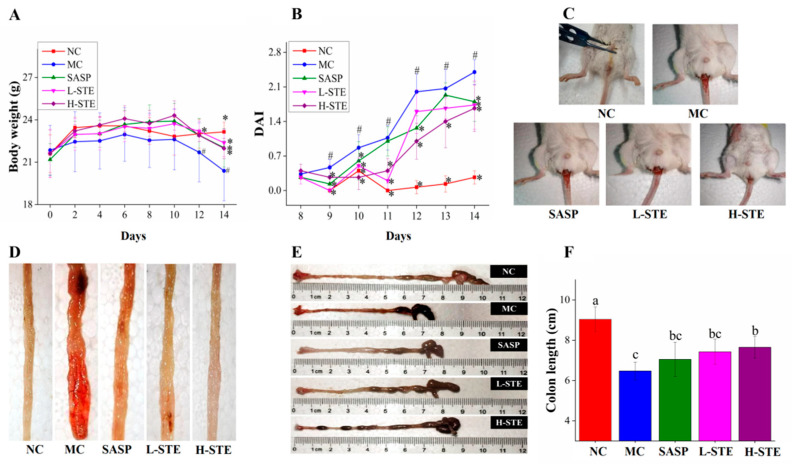
Figure 3.
Effects of STE on disease symptoms of DSS-induced ulcerative colitis mice. (A) Body weight. (B) DAI scores during DSS treatment. (C) Typical images of hematochezia. (D) Typical images of colonic tissue bleeding. (E) Representative images of colon length. (F) Colon length. Values are expressed as the mean ± the SD (n = 10). # p < 0.05 compared to the NC group; * p < 0.05 and ** p < 0.01 compared to the MC group. Bars with different lowercase letters represent significant differences (p < 0.05).

