Figure 3.
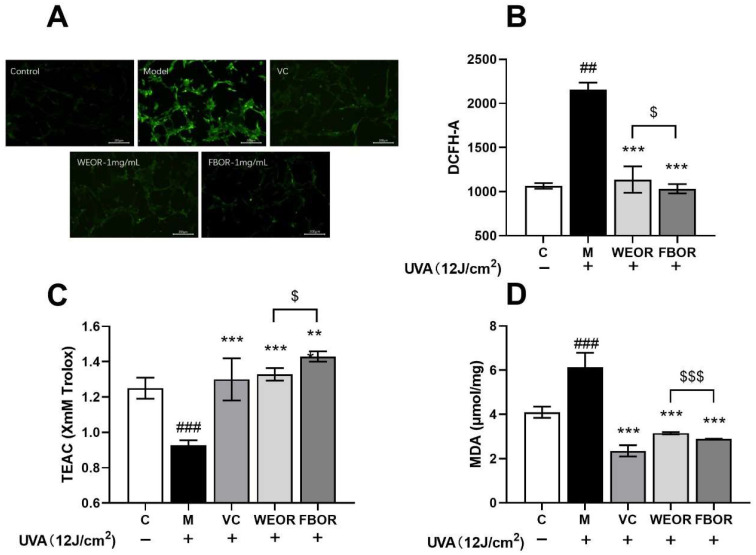
The content of ROS in HDF cells was detected by DCFH-DA staining. (A) The photomicrograph shows (10×) green fluorescence was enhanced in UVA-exposed HDF cells, and WEOR and FBOR pretreatment reduce the content of UVA-induced ROS. (B) The graph shows the fluorescence intensity of DCFH-DA in the cell. (C) The total antioxidant level in cells (ABTS); (D) Intracellular lipid oxidation level. (** p < 0.01, *** p < 0.001, versus the UVB irradiation model group; ## p < 0.01, ### p < 0.001, versus the control group. $ p < 0.05, $$$ p < 0.001, the WEOR group versus the FBOR group. C: Control group; M: UVB irradiation model group).

