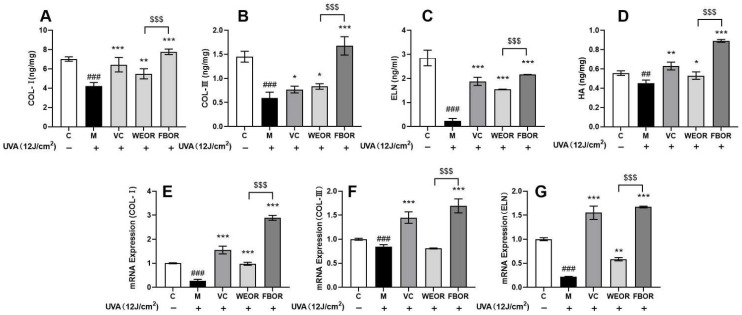
Figure 7.
The effects of WEOR and FBOR on intracellular collagen and elastin content: (A) Type I collagen content; (B) Type 3 collagen content; (C) Elastin content; (D) Hyaluronic acid content; (E) Relative expression of type I collagen mRNA; (F) Relative expression of type III collagen mRNA; (G) Relative expression of elastin mRNA. (* p < 0.05, ** p < 0.01, *** p < 0.001, versus the UVB irradiation model group; ## p < 0.01, ### p < 0.001, versus the control group. $$$ p < 0.001, the WEOR group versus the FBOR group. C: Control group; M: UVB irradiation model group).

