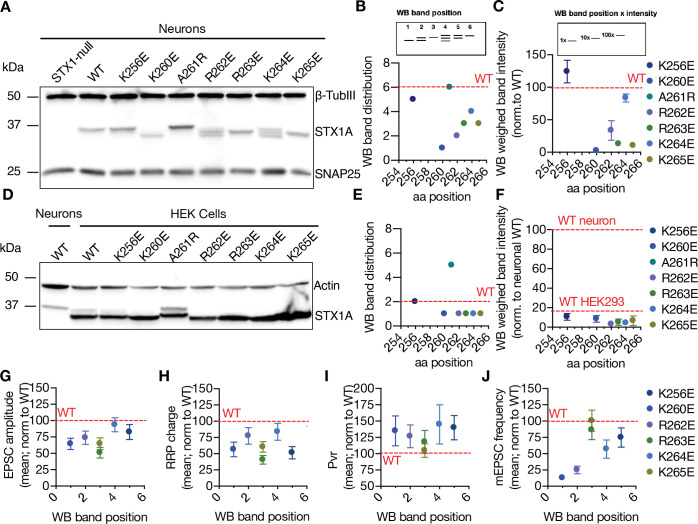
Figure 3. Charge reversal mutations in STX1A’s JMD manifest position-specific effects on the molecular weight of STX1A.
(A) Example image of SDS-PAGE of the electrophoretic analysis of lysates obtained from STX1-null neurons transduced with different STX1A JMD charge reversal mutations. (B) Quantification of the STX1A band pattern on SDS-PAGE of neuronal lysates through assignment of arbitrary hierarchical numbers from 1 to 6 based on the distance traveled, where number 1 represents the lowest single band as in STX1AK260E and number 6 represents the highest single band as in STX1AWT.(C) Quantification of the STX1A weighed band intensity of neuronal lysates for which the lowest band was arbitrarily assigned by 1 × and the highest band was assigned as 100 × and multiplied by the measured intensity of the STX1A bands. (D) Example image of SDS-PAGE of the electrophoretic analysis of lysates obtained from HEK293 cells transfected with different STX1A JMD charge reversal mutations. (E) Quantification of the STX1A band pattern on SDS-PAGE of HEK293 cell lysates as in (B). (F) Quantification of the STX1A weighed band intensity on SDS-PAGE of HEK293 cell lysates as in (C). (G) Correlation of the excitatory postsynaptic current (EPSC) amplitude normalized to that of STX1AWT to the western blot (WB) band position of STX1A charge reversal mutation. (H) Correlation of the readily releasable pool (RRP) charge normalized to that of STX1AWT to the WB band position of STX1A charge reversal mutation.(I) Correlation of vesicular probability (Pvr) normalized to that of STX1AWT to the WB band position of STX1A charge reversal mutation. (J) Correlation of the miniature excitatory postsynaptic current (mEPSC) frequency normalized to that of STX1AWT to the WB band position of STX1A charge reversal mutation. Data information: in (C, F, and G–J), data points represent mean ± SEM. Red lines in all graphs represent the STX1AWT level. The numerical values are summarized in source data.

