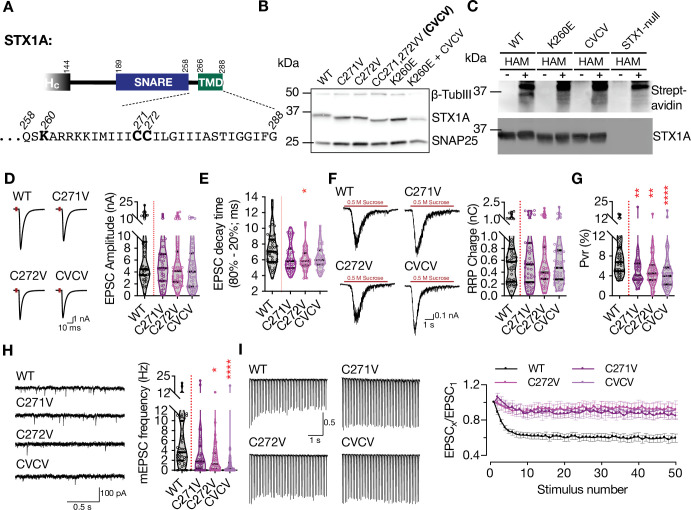
Figure 4. Charge reversal mutations in STX1A’s JMD manifest position-specific effects on different modes of neurotransmitter release.
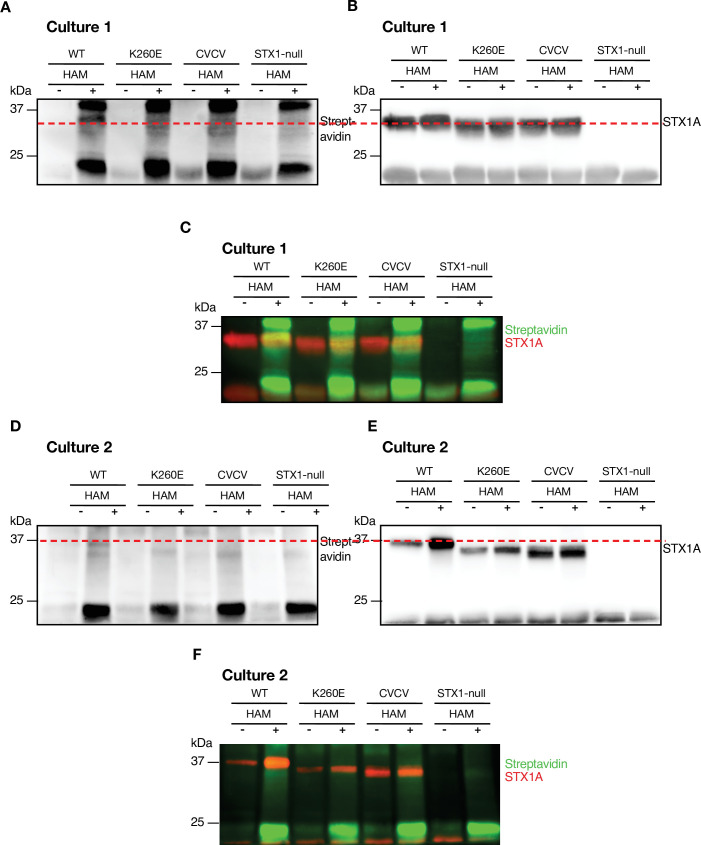
(A) Position of the palmitoylation deficiency mutations on STX1A’s TMD. (B) Example image of SDS-PAGE of the electrophoretic analysis of lysates obtained from STX1-null neurons transduced with STX1A with different palmitoylation deficiency mutations and with STX1AK260E and STX1AK260E+CVCV. (C) Example image of the SDS-PAGE of lysates of STX1-null neurons transduced with FLAG-tagged STX1AWT, STX1AK260E, or STX1ACVCV loaded onto the SDS-PAGE after Acyl-Biotin-Exchange (ABE) method and visualized by Horseradish peroxidase (HRP)-Streptavidin antibody (top panel). After stripping the Streptavidin antibody, the membrane was developed with STX1A antibody (bottom panel). (D) Example traces (left) and quantification of the amplitude (right) of excitatory postsynaptic currents (EPSCs) obtained from hippocampal autaptic STX1-null neurons rescued either with STX1AWT, STX1AC271V, STX1AC272V, or STX1ACVCV. (E) Quantification of the decay time (80–20%) of the EPSC recorded from the same neurons as in (D). (F) Example traces (left) and quantification of readily releasable pool (RRP) recorded from the same neurons as in (D). (G) Quantification of vesicular probability (Pvr) recorded from the same neurons as in (D). (H) Example traces (left) and quantification of the frequency (right) of miniature excitatory postsynaptic currents (mEPSCs) recorded from the same neurons as in (B). (I) Example traces (left) and quantification (right) of short-term plasticity (STP) measured by 50 stimulations at 10 Hz recorded from the same neurons as in (B). Data information: the artifacts are blanked in example traces in (D and F). The example traces in (H) were filtered at 1 kHz. In (D–H), data points represent single observations, the violin bars represent the distribution of the data with lines showing the median and the quartiles. In (I), data points represent mean ± SEM. Red annotations (stars) on the graphs show the significance comparisons to STX1AWT. Non-parametric Kruskal-Wallis test followed by Dunn’s post hoc test was applied to data in (D–H); *p≤0.05, **p≤0.01, ****p≤0.0001. The numerical values are summarized in source data.


