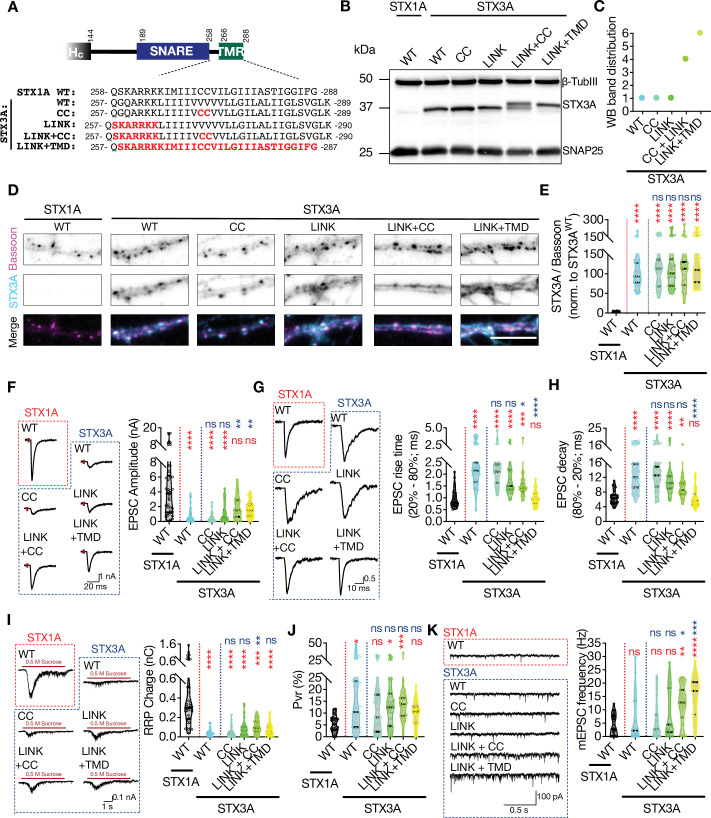
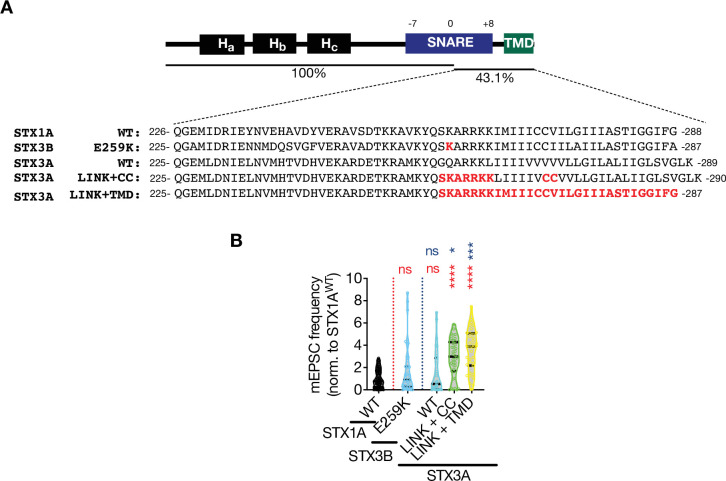
Figure 8. The impacts of palitoylation of STX1A’s TMD on spontaneous release and can be emulated by using STX3A.
(A) Comparison of the JMD and TMD regions of STX1A and STX3A and the mutations introduced into STX3A. (B) Example image of SDS-PAGE of the electrophoretic analysis of lysates obtained from STX1-null neurons transduced with STX1AWT, STX3AWT, STX3ACC, STX3ALINK+CC, or STX3ALINK+TMR. (C) Quantification of the STX3A band pattern on SDS-PAGE of neuronal lysates through assignment of arbitrary hierarchical numbers from 1 to 6 based on the distance traveled as in Figure 3A. (D) Example images of immunofluorescence labeling for Bassoon and STX3A, shown as magenta and cyan, respectively, in the corresponding composite pseudocolored images obtained from high-density cultures of STX1-null hippocampal neurons rescued with STX1AWT, STX3AWT, STX3ACC, STX3ALINK+CC, or STX3ALINK+TMR. Scale bar: 10 µm. (E) Quantification of the immunofluorescence intensity of STX3A as normalized to the immunofluorescence intensity of Bassoon in the same ROIs as shown in (D). The values were then normalized to the values obtained from STX3AWT neurons. (F) Example traces (left) and quantification of the amplitude (right) of excitatory postsynaptic currents (EPSCs) obtained from hippocampal autaptic STX1-null neurons rescued with STX1AWT, STX3AWT, STX3ACC, STX3ALINK+CC, or STX3ALINK+TMR. (G) Example traces with the peak normalized to 1 (left) and quantification of the EPSC rise time measured from 20 to 80% of the EPSC recorded from STX1-null neurons as in (F). (H) Quantification of the decay time (80–20%) of the EPSC recorded from the same neurons as in (F). (I) Example traces (left) and quantification of readily releasable pool (RRP) recorded from the same neurons as in (F). (J) Quantification of vesicular probability (Pvr) recorded from the same neurons as in (F). (K) Example traces (left) and quantification of the frequency (right) of miniature excitatory postsynaptic currents (mEPSCs) recorded from the same neurons as in (F). Data information: the artifacts are blanked in example traces in (F, G, and I). The example traces in (K) were filtered at 1 kHz. In (E–K), data points represent single observations, the violin bars represent the distribution of the data with lines showing the median and the quartiles. Red and blue annotations (stars and ns) on the graphs show the significance comparisons to STX1AWT and STX3AWT, respectively. Non-parametric Kruskal-Wallis test followed by Dunn’s post hoc test was applied to data in (C–F); *p≤0.05, **p≤0.01, ***p≤0.001, ****p≤0.0001. The numerical values are summarized in source data.


