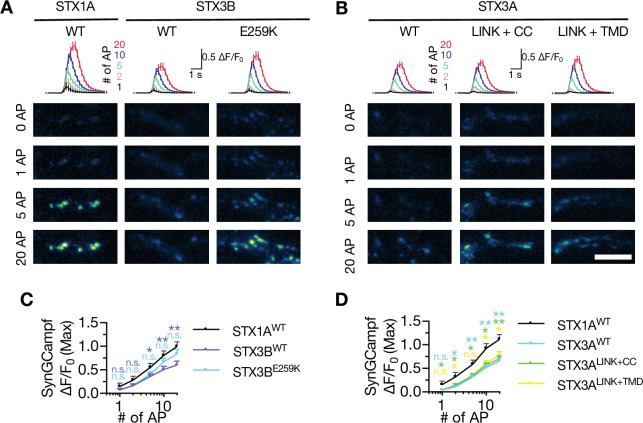
Figure 9. Neither STX3A nor STX3B rescues the global Ca2+-influx back at WT-like level in STX1-null neurons.
(A) The average (top panel) of SynGCaMP6f fluorescence as (ΔF/F0) and example images thereof (bottom panels) in STX1-null neurons rescued with STX1AWT, STX3BWT, or STX3BE259K. The images were recorded at baseline, and at 1, 2, 5, 10, and 20 APs. Scale bar: 10 µm. (B) The average (top panel) of SynGCaMP6f fluorescence as (ΔF/F0) and example images thereof (bottom panels) in STX1-null neurons rescued with STX1AWT, STX3AWT, STX3ACC, STX3ALINK+CC, or STX3ALINK+TMR. The images were recorded at baseline, and at 1, 2, 5, 10, and 20 APs. Scale bar: 10 µm. (C) Quantification of the SynGCaMP6f fluorescence as (ΔF/F0) in STX1-null neurons rescued with STX1AWT, STX3BWT, or STX3BE259K. (D) Quantification of the SynGCaMP6f fluorescence as (ΔF/F0) in STX1-null neurons rescued with STX1AWT, STX3AWT, STX3ACC, STX3ALINK+CC, or STX3ALINK+TMR. Data information: in (C and D), data points represent mean ± SEM. All annotations (stars and ns) on the graphs show the significance comparisons to STX1AWT with the color of corresponding group. Non-parametric Kruskal-Wallis test followed by Dunn’s post hoc test was applied to data in (C and D); *p≤0.05, **p≤0.01. The numerical values are summarized in source data.

