. 2022 May 18;11:e73656. doi: 10.7554/eLife.73656

Figure 2. Disruption of gastrulation correlates with changes in the transition in Notch-dependent transcription.

(A) Simplified scheme of the signaling cascade that controls MyoII contractility during Drosophila gastrulation. (B) Mean profile of m5/m8 [II] activity in α-Cat RNAi embryos compared to control embryos. (C) Correlation between the start of invagination and transition in levels of transcription in each embryo, in cta, RhoGEF2 and control RNAi embryos. (D) Mean profile of m5/m8 [II] activity in cta, RhoGEF2 and control RNAi embryos. (E) Correlation between the start of invagination and transition in levels of transcription in each embryo, in fog mutant embryos compared to control embryos and other non-fog hemizygous embryos obtained from the same cross. (F) Mean profile of m5/m8 activity in fog mutant embryos compared to control embryos and other non-fog hemizygous embryos obtained from the same cross. The transition in levels is delayed approximately 10 min in fog mutants (arrowheads). Mean transcription profiles show mean and SEM (shaded area) of MS2 fluorescent traces from all cells combined from multiple embryos (n embryo numbers indicated in each). R2 coefficients are calculated after pooling all points shown in the same plot together. The transition point was only considered when a clear change in mean levels of transcription in an individual embryo could be observed, therefore the number of points in C and E could be smaller than the total number of embryos collected for each condition.

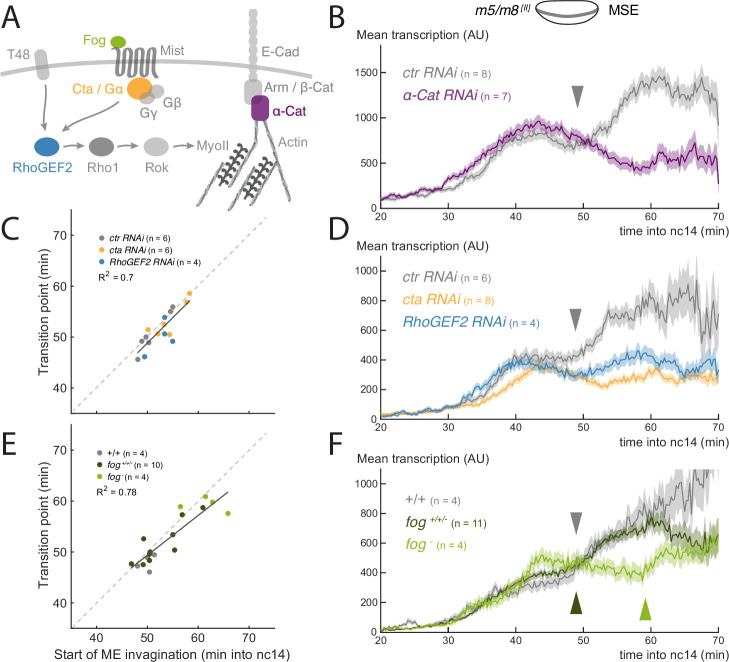
Figure 2.

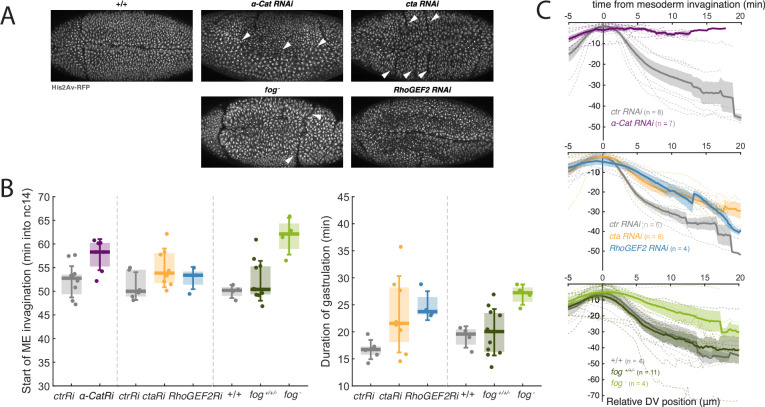
Figure 2—figure supplement 1. Genetic disruption of gastrulation.

Figure 2—figure supplement 1.

(A) Still images (maximum projection of the His2Av-RFP channel) of post-gastrulation embryos from the indicated genetic conditions captured after MS2 experiments. Arrowheads indicate ectopic folds and mesoderm cells dividing externally in α-Cat RNAi embryos. (B) Start of ME invagination (left) and total gastrulation length (right) in the indicated genotypes. Boxplots show median, Q1/Q3 quartiles and SD. (C) Quantification of the movement of MSE nuclei over time in the Y axis (representing movement in the DV axis), aligned by the time of ME invagination, in the indicated genetic conditions. 0 represents the highest (most dorsal) position achieved, therefore during gastrulation MSE nuclei move towards negative positions. Mean and SEM (solid line and shaded area) of multiple embryos shown (n embryo numbers indicated in each). Dashed lines indicate mean profiles for individual embryos. Because α-Cat RNAi embryos do not gastrulate, total duration of gastrulation was not quantified, and mesoderm invagination has been defined, based on the overall changes occurring in the embryo, as the time when it would normally initiate.
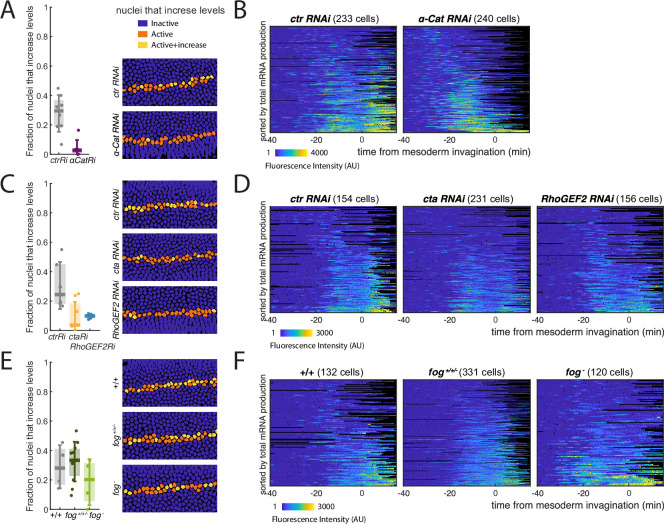
Figure 2—figure supplement 2. Effects of genetic manipulations to gastrulation on the increase in m5/m8 [II] transcription.

Figure 2—figure supplement 2.

(ACE) Boxplots showing proportion of active cells in each embryo that increase levels of m5/m8 [II] transcription at the time of gastrulation (left; median, Q1/Q3 and SD shown) and still frame with tracked nuclei color-coded for whether they increase in levels during gastrulation (right), in the indicated genetic conditions: α-Cat and control RNAi (A), cta, RhoGEF2 and control RNAi (C) and fog- embryos compared to controls and other non-fog hemizygous embryos obtained from the same cross - fog+/+/- (E). (BDF) Heatmaps showing m5/m8 [II] activity in all MSE cells over time, aligned by the time of ME invagination, in the indicated genetic conditions: α-Cat and control RNAi (B), cta, RhoGEF2 and control RNAi (D) and fog- embryos compared to controls and other non-fog hemizygous embryos obtained from the same cross - fog+/+/- (F).
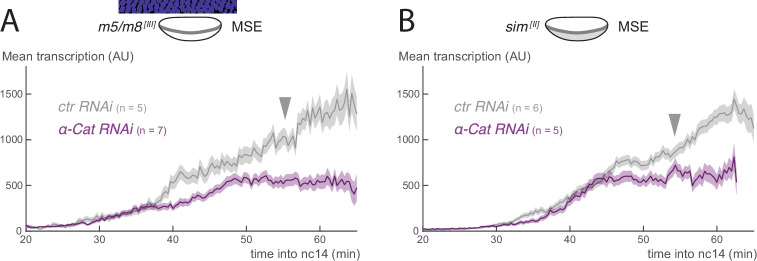
Figure 2—figure supplement 3. Gastrulation also influences other Notch-responsive enhancers.

Figure 2—figure supplement 3.

(A) Mean profile of m5/m8 [III] activity in α-Cat RNAi embryos compared to control embryos. (B) Mean profile of sim [III] activity in α-Cat RNAi embryos compared to control embryos. Mean transcription profiles show mean and SEM (shaded area) of MS2 fluorescent traces from all cells combined from multiple embryos (n embryo numbers indicated in each).
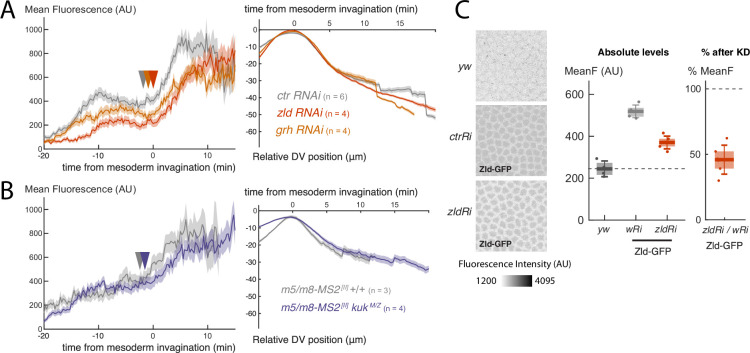
Figure 2—figure supplement 4. Other genetic manipulations do not alter transcription profiles during gastrulation.

Figure 2—figure supplement 4.

(A) Mean profile of m5/m8 [II] activity (left) and movement of MSE nuclei over time in the Y axis (representing movement in the DV axis, right) in zld and grh RNAi embryos compared to control embryos. (B) Mean profile of m5/m8 [II] activity (left) and movement of MSE nuclei over time in the Y axis (representing movement in the DV axis, right) in kuk M/Z compared to control embryos (re-analyzed from Falo-Sanjuan and Bray, 2021). (C) Quantification of the degree of maternal Zelda KD by quantifying Zld-GFP fluorescence in embryos in the presence of control and zld RNAi. Mean transcription profiles show mean and SEM (shaded area) of MS2 fluorescent traces from all cells combined from multiple embryos (n embryo numbers indicated in each).