. 2022 May 18;11:e73656. doi: 10.7554/eLife.73656

Figure 6. Nuclear levels of Twist and chromatin properties during gastrulation.

(A) Still images from a video of an embryo expressing endogenous Twist fused to LlamaTag, which binds mCherry and allows to visualize nuclear levels of zygotically produced Twist (see C). Arrowhead indicates the position of the mesectoderm, note that Twist levels remain lower in these nuclei than in the central mesoderm. (B) Quantification of nuclear levels of Twist in mesoderm and mesectoderm during gastrulation. (C) LlamaTag approach: Twist is fused to an anti-mCherry nanobody (LlamaTag) that binds free and already fluorescent mCherry that has been maternally loaded in the embryo. (D) Still of the start of mesoderm invagination from a video of an embryo expressing the nuclear membrane marker Nup107-RFP (cyan) and MCP-GFP (grey) to quantify m5/m8 [II] transcription and mark mesectoderm nuclei (left) and segmented nuclei color-coded based on the different cell populations defined from MS2 signal (ME: mesoderm, MSE: mesectoderm, NE: neuroectoderm). Center panel shows view from the top and right panel shows lateral view. (E) Quantification of average His2Av-RFP intensity around the MS2 spot, as a proxy of chromatin compaction, over time in control and α-Cat RNAi embryos. (F) Quantification of the average MS2 spot movement (distance moved relative to the nucleus centroid / time) over time in control and α-Cat RNAi embryos. B, E and F show mean and SEM (shaded area) from all cells combined from multiple embryos (n embryo numbers indicated in each). In F, values were smoothed over time using a median filter of 8 frames (2 min).

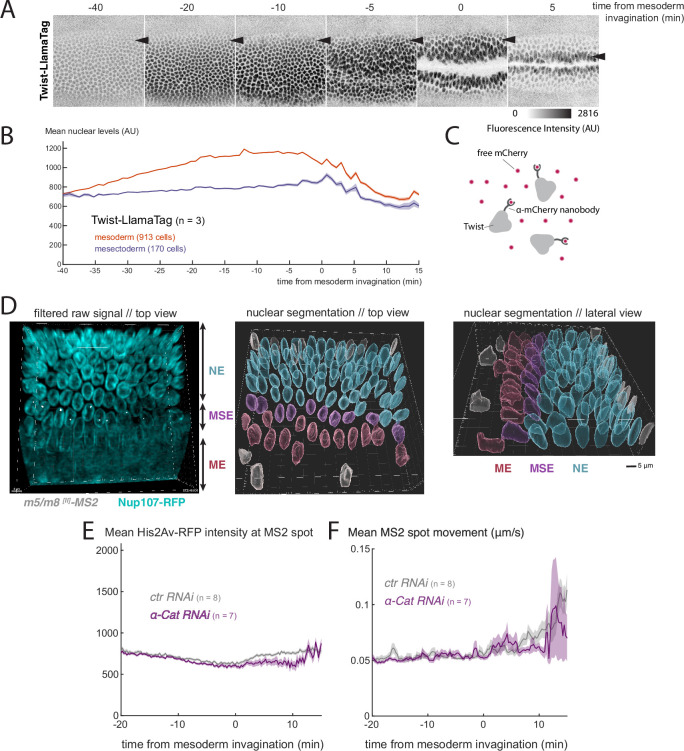
Figure 6.

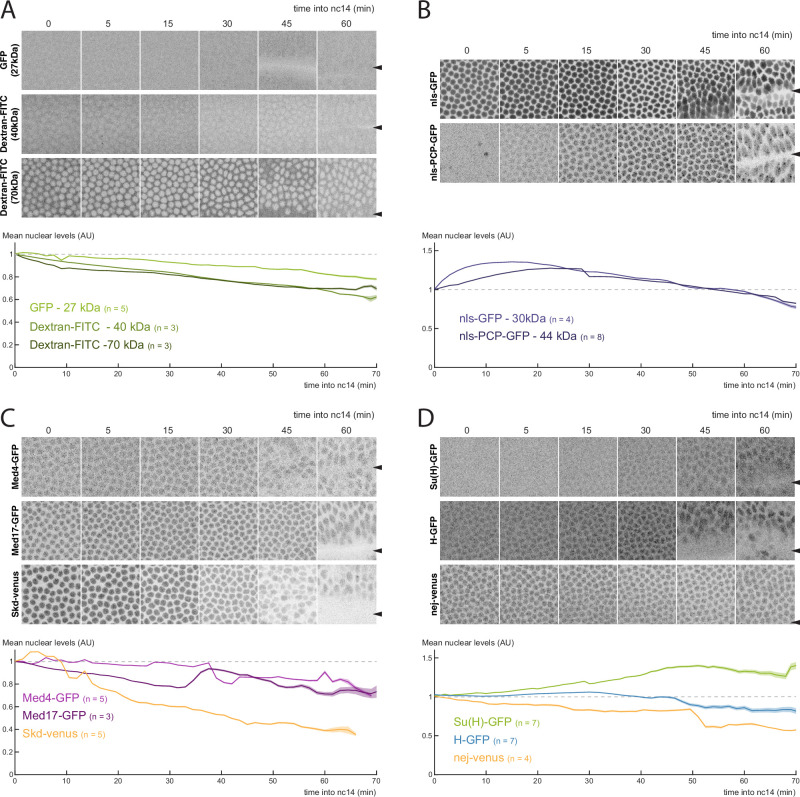
Figure 6—figure supplement 1. Nuclear import does not change during gastrulation.

Figure 6—figure supplement 1.

Nuclear levels of GFP and fluorescently-tagged dextrans (A), nls-containing proteins (B), members of the mediator complex (C) and regulators of Notch signaling (D) during gastrulation. In each panel, top half shows still from videos of the fluorescent factor quantified in each condition (inverted maximum intensity projection). Arrowheads indicate position of the mesoderm invagination furrow. Bottom half shows quantification of the nuclear levels over time, showing mean and SEM (shaded area) of all cells combined from multiple embryos (n numbers shown in each).
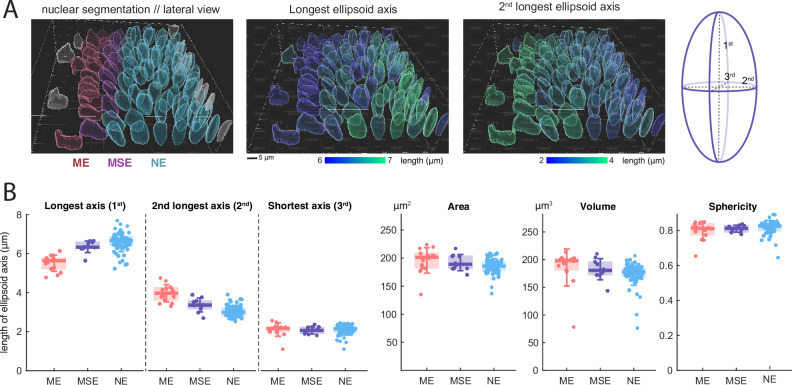
Figure 6—figure supplement 2. Quantification of nuclear size and shape during gastrulation.

Figure 6—figure supplement 2.

(A) Lateral view of segmented nuclei color-coded based on the different cell populations defined from MS2 signal (ME: mesoderm, MSE: mesectoderm, NE: neuroectoderm, left) and color-coded by length of the longest ellipsoid axis (middle) and 2nd longest axis (right). (B) Quantification of morphological properties of ME, MSE, and NE nuclei at the start of mesoderm invagination. Boxplots show median, Q1/Q3 quartiles and SD.
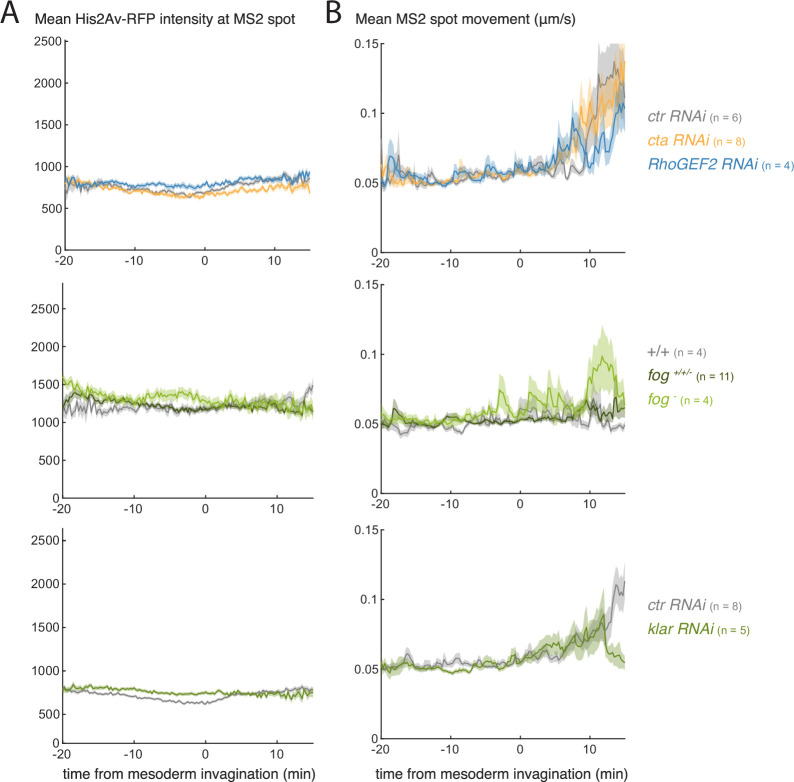
Figure 6—figure supplement 3. Quantification of chromatin properties during gastrulation.

Figure 6—figure supplement 3.

(A) Quantification of average His2Av-RFP intensity around the MS2 spot, as a proxy of chromatin compaction, over time in the indicated genetic conditions. (B) Quantification of the average MS2 spot movement (distance moved relative to the nucleus centroid / time) over time in in the indicated genetic conditions. Mean and SEM (solid line and shaded area) of multiple embryos shown (n embryo numbers indicated in each). In B, values were smoothed over time using a median filter of 8 frames (2 minutes).