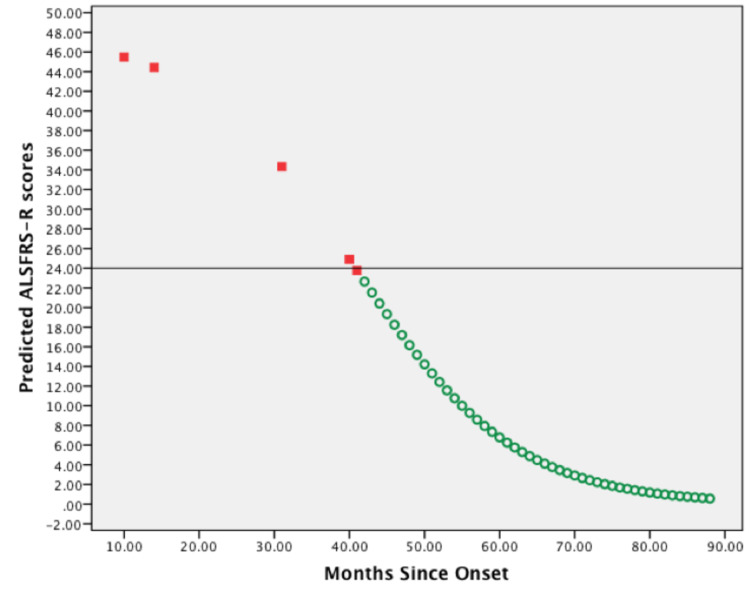
Figure 1. Scatterplot of predicted ALSFRS-R scores vs. months since symptoms onset of one representative patient.
The first five predicted ALSFRS-R scores were plotted against months since symptoms onset of the documented patient's visits (red squares). Predicted ALSFRS-R scores were also plotted against months since symptoms onset of increments of =1 (green circles). A horizontal line is shown at the inflection point (ALFRS-R score = 24) of the sigmoidal curve. The predictions were generated using optimal parameter values by iteration.
ALSFRS-R: amyotrophic lateral sclerosis functional rating scale-revised.

