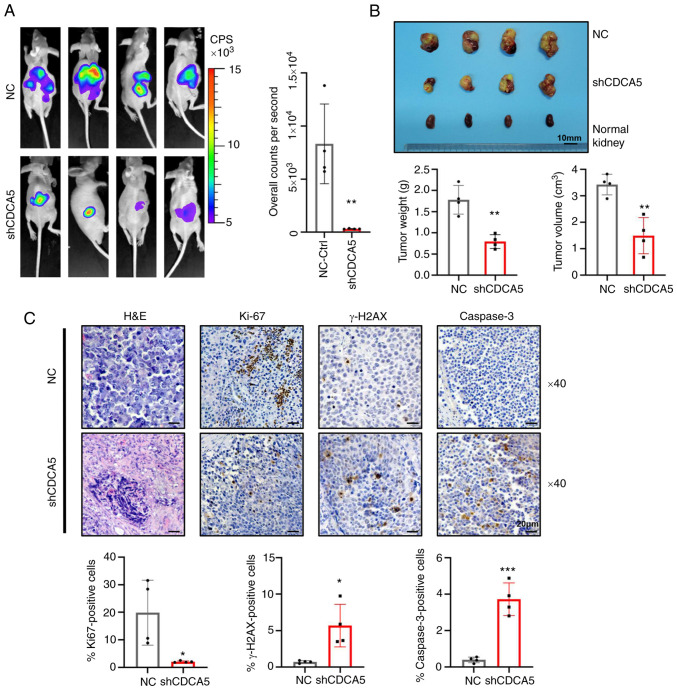
Figure 8.
Knockdown of CDCA5 suppresses tumorigenesis and tumor growth of ccRCC cells in vivo. (A) Bioluminescence imaging by luciferase in an orthotopic ccRCC xenograft mouse model. The luciferase signaling intensity of overall counts per second was decreased in the shCDCA5 group with statistical significance. (B) The xenograft tumors were collected at 4 weeks after injection. Compared to the NC control group, tumors were smaller in the shCDCA5 group. The weight and volume of the excised xenograft tumors were analyzed between the two groups. Scale bar, 10 mm. (C) Representative graphs and quantification of H&E staining and immunohistochemistry assays for Ki67, γ-H2AX and caspase-3 in the tumor sections. Magnification, ×40; scale bar, 20 µm. *P<0.05, **P<0.01 and ***P<0.001 vs. negative control. CDCA5, cell division cycle-associated 5; ccRCC, clear cell renal cell carcinoma; NC, negative control; γ-H2AX, γ-H2A histone family member X.

