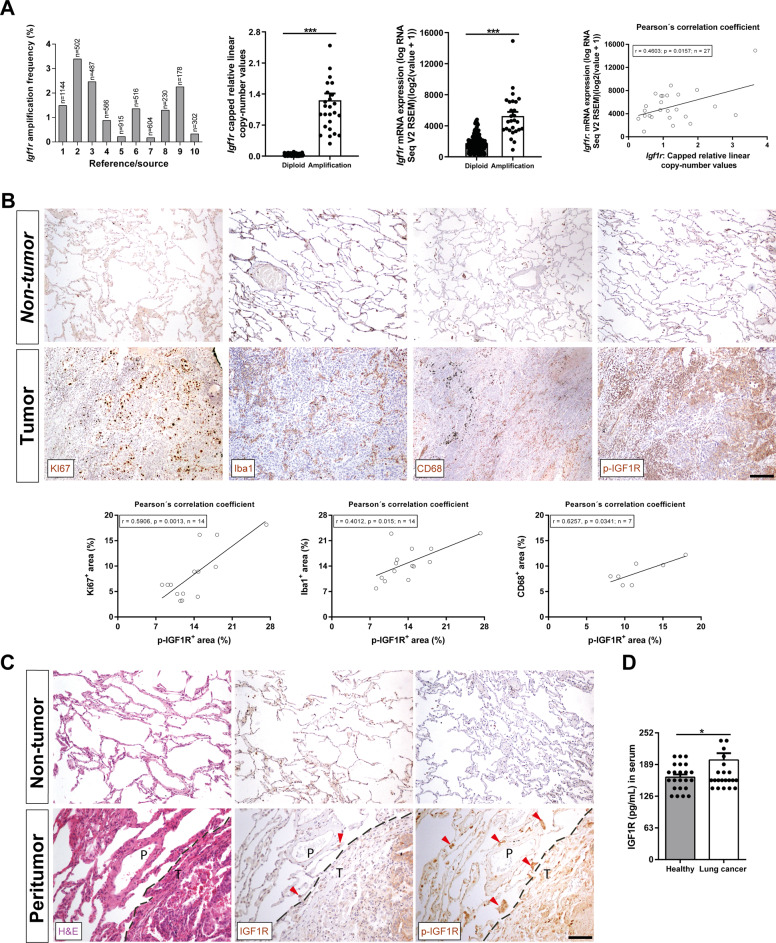
Fig. 1. Increased IGF1R amplification and mRNA expression, as well as upregulation of IGF1R protein expression in NSCLC patient tumor samples and serum.
A IGF1R gene amplification frequency, copy number values and mRNA expression levels, as well as Pearson´s correlation of IGF1R copy number values with mRNA expression in tumor samples from NSCLC patients. Data were obtained from the cBio Cancer Genomics Portal (cBioPortal). B Representative immunostains for Ki67 (proliferation), Iba1 (macrophages), CD68 (tumor-associated macrophages, TAMs) and p-IGF1R in tumoral and non-tumoral tissues from NSCLC patients (n = 7–14; Scale bar: 125 µm), and respective Pearson´s correlations of p-IGF1R+ area with Ki67+,Iba1+ and CD68+ areas (%). C Representative stains for H&E and immunostains for IGF1R and p-IGF1R in peritumoral lung tissues from NSCLC patients (dashed lines indicate limits between peritumoral (P) and tumoral (T) areas. Note accumulations of infiltrated immune cells in P (red arrows). D Serum IGF1R levels from NSCLC patients and controls (n = 24). In bar graphs, data are expressed as mean ± SEM. *p < 0.05; ***p < 0.001 (Mann–Whitney U test for comparing two groups and Pearson´s correlation coefficient).

