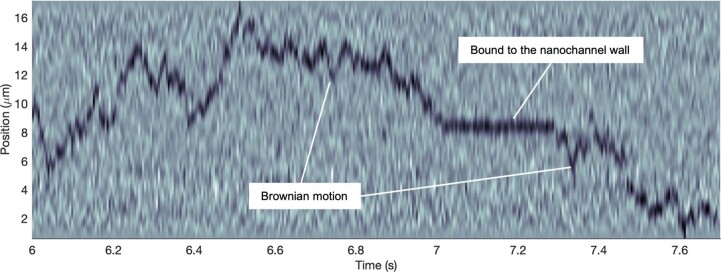
Extended Data Fig. 5. Ferritin–nanochannel wall interaction.
Kymograph of a single ferritin molecule inside Channel II. For each time frame, the dark spot in the image corresponds to the position of the ferritin that resides inside the field of the view. The position of the biomolecule changes stochastically in the left and right part of the image, whereas in the central part, it remains fixed for about 0.3 s. These two different behaviors correspond to two different states of a biomolecule – freely diffusing and bound to the nanochannel wall, respectively. The trajectory of the biomolecule was found using a particle tracking algorithm and from the statistics of the movement, the part of the trajectory corresponding to the bound state was identified and excluded from the further analysis (more details in SI section “Particle tracking”).

