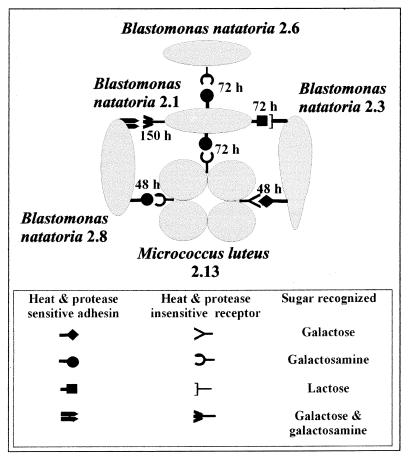
FIG. 3.
Diagrammatic representation of specific intergeneric and interstrain (intraspecies) coaggregation between aquatic bacteria. Cells are not drawn to scale. M. luteus 2.13 grows as tetrads, and B. natatoria 2.3 is a club-shaped rod. B. natatoria 2.1, 2.6, and 2.8 are symmetrical small rods. Each interaction is shown as complementary symbols representing a protein adhesin (lectin) or a sugar (saccharide) receptor. Numbers represent the length of time (hours) of growth in batch culture for optimal coaggregation to occur for each pair.

