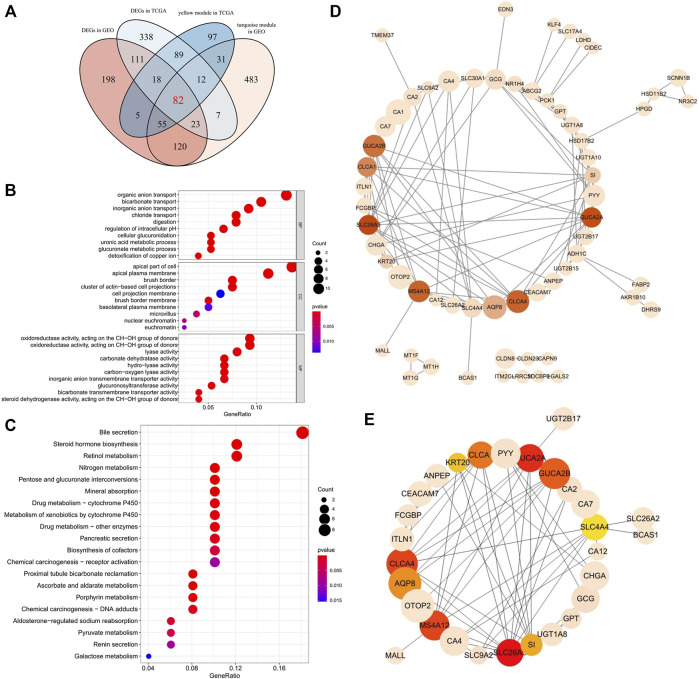
FIGURE 3.
(A)Venn diagram of DEGs and the gene list from the co-expression module. A total of 82 overlapping genes in the intersection of DEGs and two gene lists from the co-expression module. (B) Gene Ontology (GO) enrichment analysis for the 82 overlapping genes. The color of each bubble represents the p value, and the bubble size represents the number of genes. (C) KEGG pathways enrichment analysis for the 82 overlapping genes. The color of each bubble represents the p value, and the bubble size represents the number of genes. (D) PPI network of the 82 overlapping target genes. There were 82 nodes, where nodes represented genes, and edges were the interactions between two genes. Red is the higher score calculated by the MCC method, followed by yellow, and the size of nodes corresponds to absolute logFC values. (E) A total of 10 hub genes were identified from 82 genes via MCC algorithm analysis. Network nodes represent proteins; edges represent protein–protein associations. Red is the higher score calculated by the MCC method, followed by yellow, and the size of nodes corresponds to absolute logFC values.

