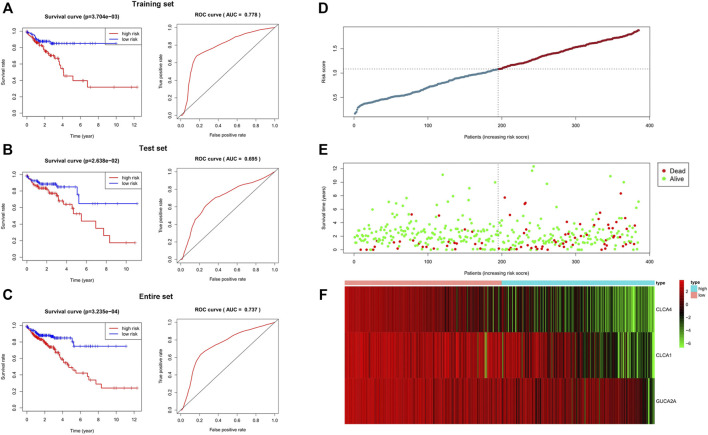
FIGURE 5.
Validation of the 3-gene signature. In all three sets, there were significant differences in OS between the high-risk group and the low-risk group. The area under the ROC was 0.778 in the training set, 0.695 in the test set, and 0.737 in the entire set. The results showed that the 3-gene signature performed well in predicting the prognosis of colorectal adenocarcinoma. (A) Training set. (B) Test set. (C) Entire set. (D–F) Distributions of the 3-gene signature, survival status, and expression profiles of the three genes of entire sets.

