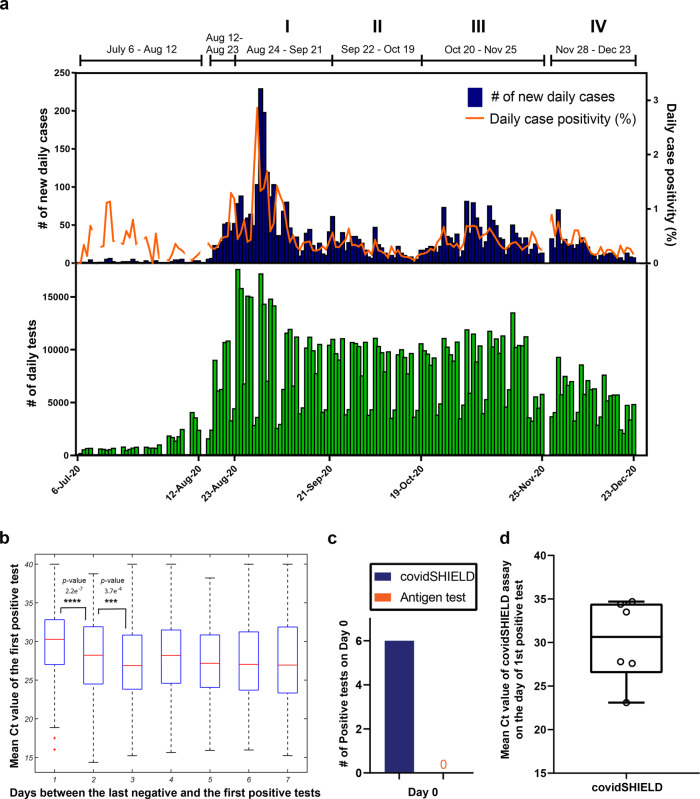
Fig. 3. Deployment of frequent repeat testing at the University of Illinois in fall 2020.
a Timeline of detected cases during surveillance testing from July 6 to December 23, 2020. The top panel displays the daily new cases (blue) and the daily case positivity (orange). The daily case positivity is computed as the (number of new cases)/(unique number of individuals tested during the day). The lower panel shows the number of daily tests performed (green), which to an excellent approximation is the same as the number of unique individuals tested in a day. b Ct values of the first positive test as a function of time elapsed since the last negative test. The difference between the first (1 day) and the second (2 days) bins is highly statistically significant (p-value 2.2e−7), and that between the second (2 days) and the third (3 days) bins is statistically significant (p-value 3.7e−4). p-values shown are for the two-sided hypothesis of non-zero Pearson correlation between the number of days since the last negative test (x-axis) and the Ct value of the first positive test (y-axis). The exact sample sizes are: 341 patients who test positive 1 day since the last negative, 616 patients—2 days since the last negative, 716 patients—3 days since the last negative, and 1230 patients—between 4 and 7 days since the last negative. The box plots were generated using the command boxplot in Matlab 9.10.0.1684407(R2021a). The bottom and top of each box are the 25th and 75th percentiles of the sample, respectively. The distance between the bottom and top of each box is the interquartile range. The red line in the middle of each box is the median. The whiskers go from the end of the interquartile range to the furthest observation within the whisker length which is 1.5× the interquartile range. The outliers are marked with red + sign and are defined as the observations that go beyond the whisker length. c Head-to-head daily testing with covidSHIELD and antigen-based lateral flow assays in a subgroup of participants (n = 190) from October 1, 2020 to Dec 23, 2020. A total of 13,299 contemporaneous tests were performed. Of the 190 individuals, 6 tested positive for SARS-CoV-2 on Day 0 using the covidSHIELD test but all six tested negative using the antigen test. Blue and orange bars represent the percentage of participants that tested positive for SARS-CoV-2 on day 0 using covidSHIELD and the antigen test, respectively. d Box-and-whiskers plot of mean Ct values of the 6 individuals who tested positive for SARS-CoV-2 using the covidSHIELD assay on Day 0. Data was plotted using GraphPad Prism v9.3.1, where the lower and upper box extends from 25th to 75th percentiles, respectively, the line in the middle of the box is the median, the lower and upper error lines are the minimum and maximum value, respectively; each individual values are plotted as circles superimposed on the graph.

