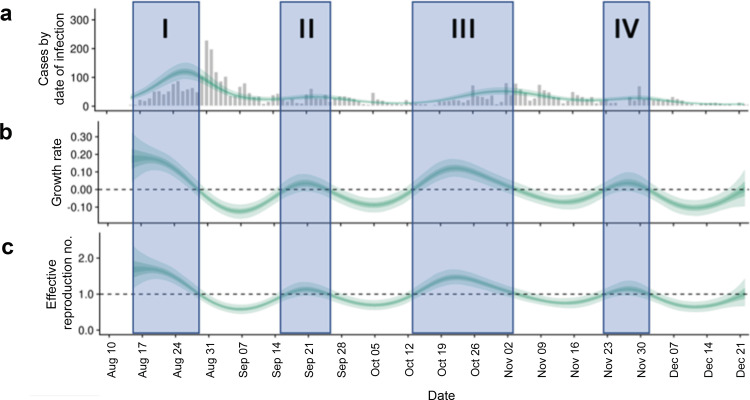
Fig. 4. Epidemiological analysis for COVID-19 cases on campus.
a Cases estimated by date of infection. b Estimated growth rate. c Estimated effective reproduction number Reff by the date of infection as a function of time using the method of Cori et al. assuming gamma-distributed generation time distribution62 and a distribution between consecutive tests shown in Supplementary Fig. 7. The shaded periods (I–IV) correspond to periods of the semester when Reff > 1 suggesting transient growth of cases. The unshaded time periods correspond to Reff < 1 suggesting that the epidemic is controlled, and cases are decreasing. In each subplot, the credible intervals for the calculation of that output are shown with three shades. These three shades correspond to credible intervals of 20% (darkest green), 50% (lighter green), and 90% (lightest green). Analysis was done using Epidemiological toolbox EpiNow246. Please see the “Methods” section for more details.

