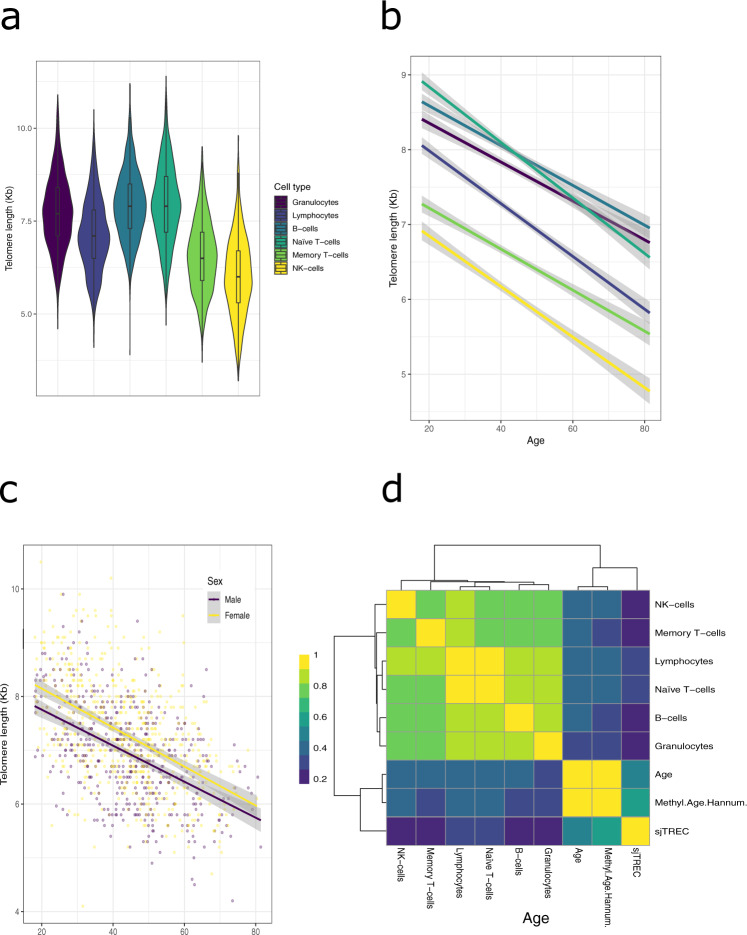
Fig. 1. Telomere measurements in six blood cell types.
a Distribution of telomere length by cell type. b Average trend line of telomere length. Grey shading indicates 95% confidence interval. Length decreases with age in all six cell types. Colour indicates cell type in both (a, b). c Sexual dimorphism of telomere length (shown in lymphocytes). Trend line indicates average length per age. Grey shading indicates 95% confidence interval. d Heatmap displaying the absolute correlation value (Spearman’s rho) between telomere lengths, chronological age (Age), Hannum-based methylation age and sjTRECs' qPCR relative expression.

