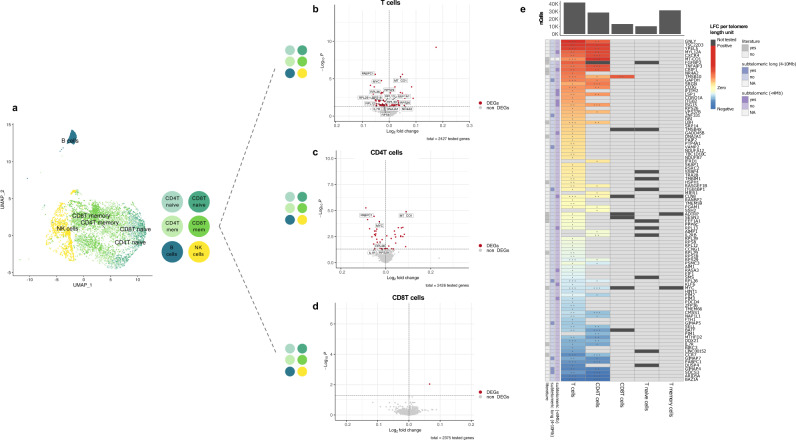
Fig. 4. Differential gene expression changes with telomere length across cell types.
a UMAP plot of the cells from the subset of 62 LLD donors with both scRNA-seq and Flow-FISH telomere length data. The cells are coloured by the cell type classification that closely reflects the resolution of the Flow-FISH annotations (i.e., naïve and memory -mem- CD4T and CD8T cells, NK- and B-cells). For visualisation purposes, we down-sampled each of Azimuth’s predicted cell types to 500 cells. b–d Volcano plots showing the results of DE approach II in T-, CD4T and CD8T cells, respectively. For DE approach II, we combined multiple cell types together (in a) in the same analysis (i.e., combining all T, all CD4T, all CD8T, all naïve T and all memory T-cells). DEGs with telomere length are represented in red. Non-DEGs are represented in grey. Labels correspond to the DEGs mentioned in the text. e Heatmap of log-fold change (LFC) per telomere length unit for the set of 97 unique DEGs identified in T-, CD4T and CD8T cells. Non-DEGs are shown in light grey. Genes not tested (i.e., those below 10% expression cut-off) are shown in dark grey. The significance level of the DEGs corresponds to the following arbitrary FDR thresholds: FDR < 1 × 10⁻³ (***), FDR < 0.01 (**) and FDR < 0.05 (*). The genes are sorted by their average LFC across cell types. The row annotation bars show whether the genes are located at the subtelomeric (<4 Mb) or subtelomeric long (4–10 Mb) region and if the genes were previously reported in any of the following studies: Pellegrino-Coppola et al.53, Tacutu R et al.54, Buxton JL et al.29 or Nittis T et al.51 (Supplementary Data 11). The distance to the telomeres was not calculated for the mitochondrial gene (MT-CO1) (subtelomeric (<4 Mb) and subtelomeric long (4–10 Mb) = NA). The column annotation on the bar plot shows the total number of cells (nCells) per cell type.

