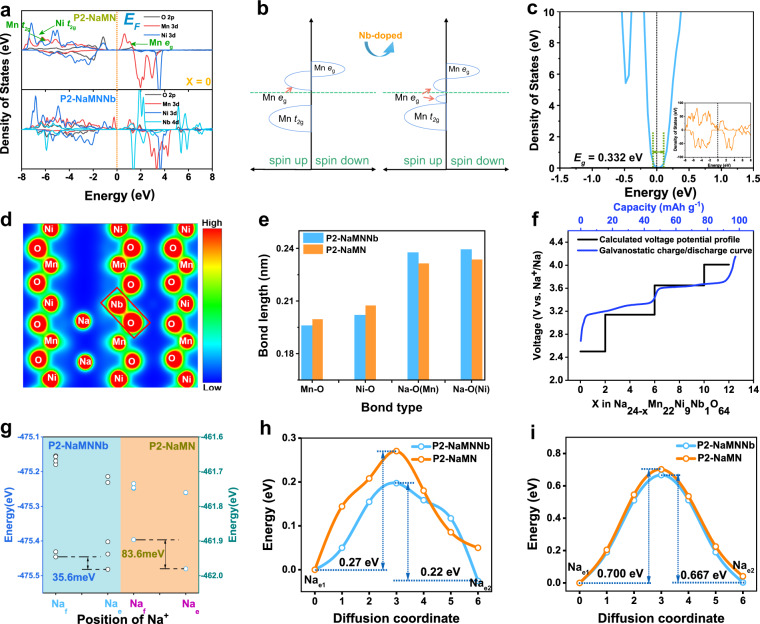
Fig. 6. Theoretical investigations on the evolution of the P2-NaMNNb and P2-NaMN electronic structures.
a Partial density of states (pDOS) of O 2p, Mn 3d, and Ni 3d and Ni 4d orbitals with x = 0. b Schematic pDOS of P2-NaMN and P2-NaMNNb with x = 0. c The total density of state of Na24Ni9Mn22Nb1O64. d Charge density distribution for P2-NaMNNb (visualized by Visualization for Electronic and Structure Analysis (VESTA)), the red regions stand for high charge density and blue regions for low charge density). e The comparison of average bond length for TM-O and Na-O of P2-NaMN and P2-NaMNNb. f Comparison of calculated voltage potential and galvanostatic charge/discharge curves at 92 mA g−1 and 25 °C in coin cell. g Calculated energy difference between the Nae and Naf site for P2-NaMNNb (blue background) and P2-NaMN (orange background). Calculated Na+ ion diffusion pathways of P2-NaMNNb with h Na deficient status, i Na rich status, and the corresponding Na+ migration energy barriers of P2-NaMN and P2-NaMNNb.

