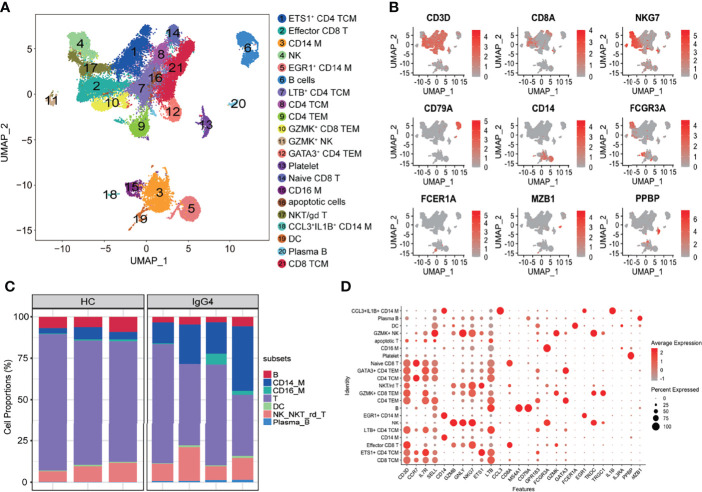
Figure 1.
Overview of the clustering and annotation of the sc-RNA sequencing data for IgG4-RD. (A) UMAP representation of 47,219 single cells from HCs (n = 3) and IgG4-RD (n = 4), showing the formation of 21 clusters. (B) Canonical cell markers used to label major cell types represented in the UMAP plot. The legend is labeled in log scale. (C) Bar plot showing cluster abundance of major cell types across all samples. (D) Bubble heatmap showing the selected markers annotating specific cell types. The size of the dot indicates the fraction of expressing cells, colored according to z-score–normalized expression levels.

