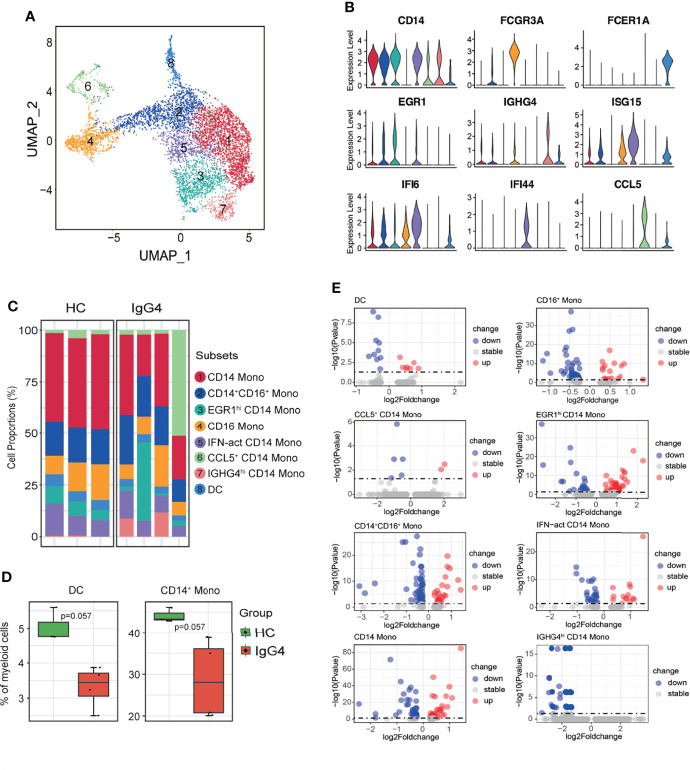
Figure 3.
The heterogeneity and transcriptional features of myeloid cells in IgG4-RD. (A) UMAP representation of 6324 myeloid cells, showing the formation of 8 clusters. (B) Violin plots showing expression distribution of canonical cell markers. (C) Bar plot showing cluster abundance of each myeloid cell type across all samples. (D) Percentages of DC and CD14+ Mono between HCs and IgG4-RD. The y-axis shows the average percentage. Error bars are shown in mean ± SEM. Student t-test was used for the analysis, and P < 0.05 is considered a significant difference. (E) Volcano plot showing the DEGs of myeloid cell subtypes between HCs and patients with IgG4-RD. Data are expressed as mean ± SD.

