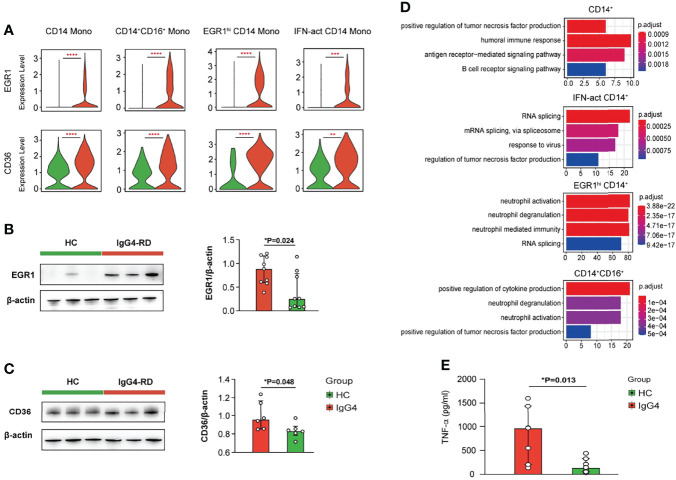
Figure 4.
Functional analysis of myeloid cells in IgG4-RD. (A) Violin plots showing expression of EGR1 and CD36 in different CD14+ mono subtypes. (B, C) The comparison of EGR1 and CD36 expressions in purified CD14+ monocytes from HCs and patients with IgG4-RD. (D) GO analysis showing the biological process enriched in different CD14+ monocytes of patients with IgG4-RD. (E) CD14+ monocytes purified from PBMCs of HCs and patients with IgG4-RD and cultured for 12 h in vitro. The TNF-α in the supernatant was measured using ELISA. Data are expressed as mean ± SD, *P < 0.05, **P < 0.01, ***P < 0.001, and ****P < 0.0001.

