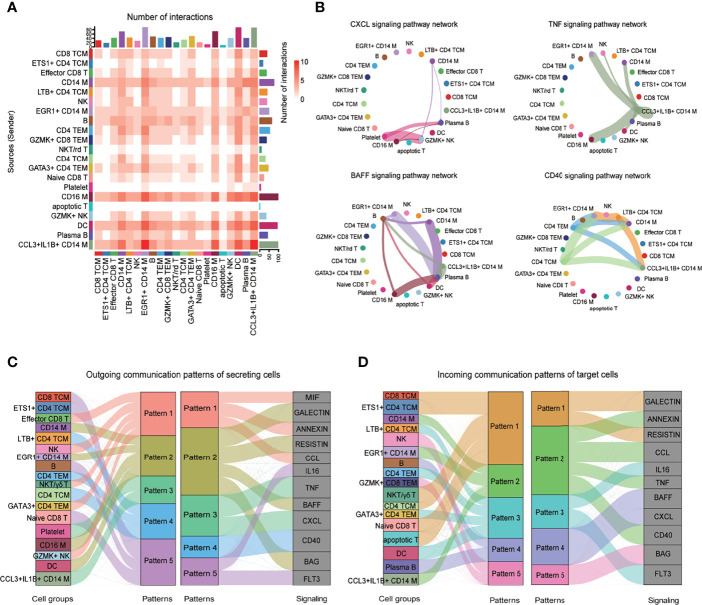
Figure 7.
CellChat analysis of the communications among immune cells. (A) Heatmap showing the number of interactions of different cell subsets in PBMCs. (B) Circle plot showing the inferred intercellular communication network for CXCL, TNF, BAFF, and CD40 signaling among different cell subsets. The number of cells in each cluster is proportional to the circle size, and the line thickness represents the strength of signaling. (C) The inferred outgoing communication patterns of secreting cells, which shows the correspondence between the inferred latent patterns and cell groups, and signaling pathways. The thickness of the flow indicates the contribution of the cell group or signaling pathway to each latent pattern. (D) The inferred incoming communication patterns of target cells.

