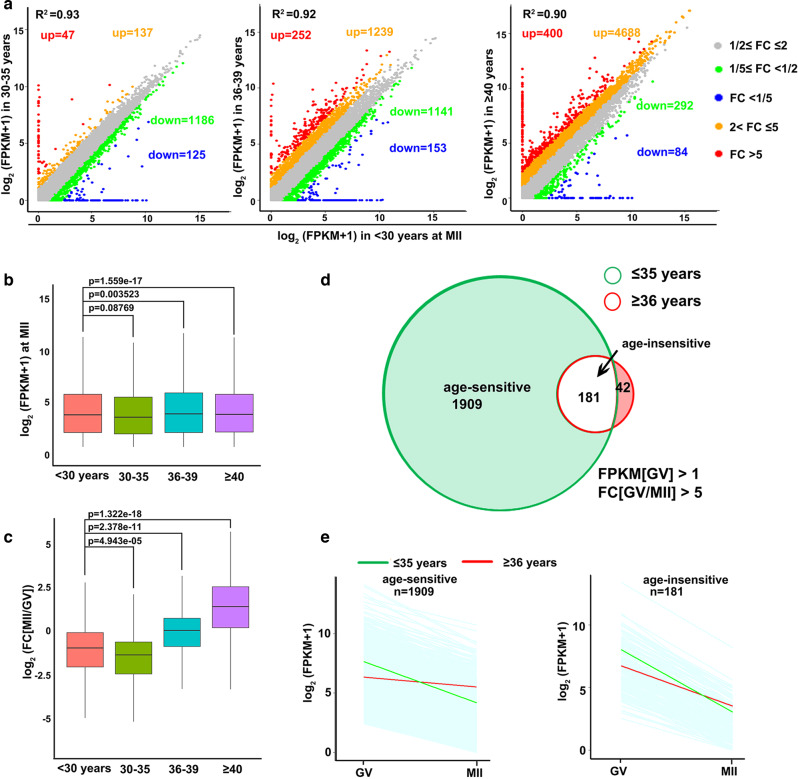
Fig. 2. Age-associated changes in mRNA degradation during GV-MII transition in human oocytes.
a Scatter plots of RNA-seq data illustrating the transcriptional changes in human MII oocytes of different ages. Transcripts that decreased or increased by more than 2-fold or 5-fold compared with oocytes of women younger than 30 years old are highlighted with different colors. b Box plot showing gene expression levels in human MII oocytes of different ages. n = 3 biologically independent samples were included in each group. The box indicates the upper and lower quantiles, the thick line in the box indicates the median and whiskers indicates 2.5th and 97.5th percentiles.. P-values by a two-tailed Student’s t-test are indicated. c Box plot showing fold changes in mRNA levels in MII versus GV oocytes from women of different ages. n = 3 biologically independent samples were included in each group. The box indicates the upper and lower quantiles, the thick line in the box indicates the median and whiskers indicates 2.5th and 97.5th percentiles. P-values by a two-tailed Student’s t-test are indicated. d Venn diagram showing the overlap of M-decay transcripts (decreased 5 fold from GV to MII stage) in oocytes from women younger and older than 35 years. e Degradation patterns of human maternal transcripts during the GV-MII transition in oocytes derived from women aged ≤ and >35 years. Each light blue line represents the expression levels of one gene, and the middle red and green lines represent the median expression levels of the group. Transcripts with FPKM > 1 at the GV stage were selected and analyzed.

